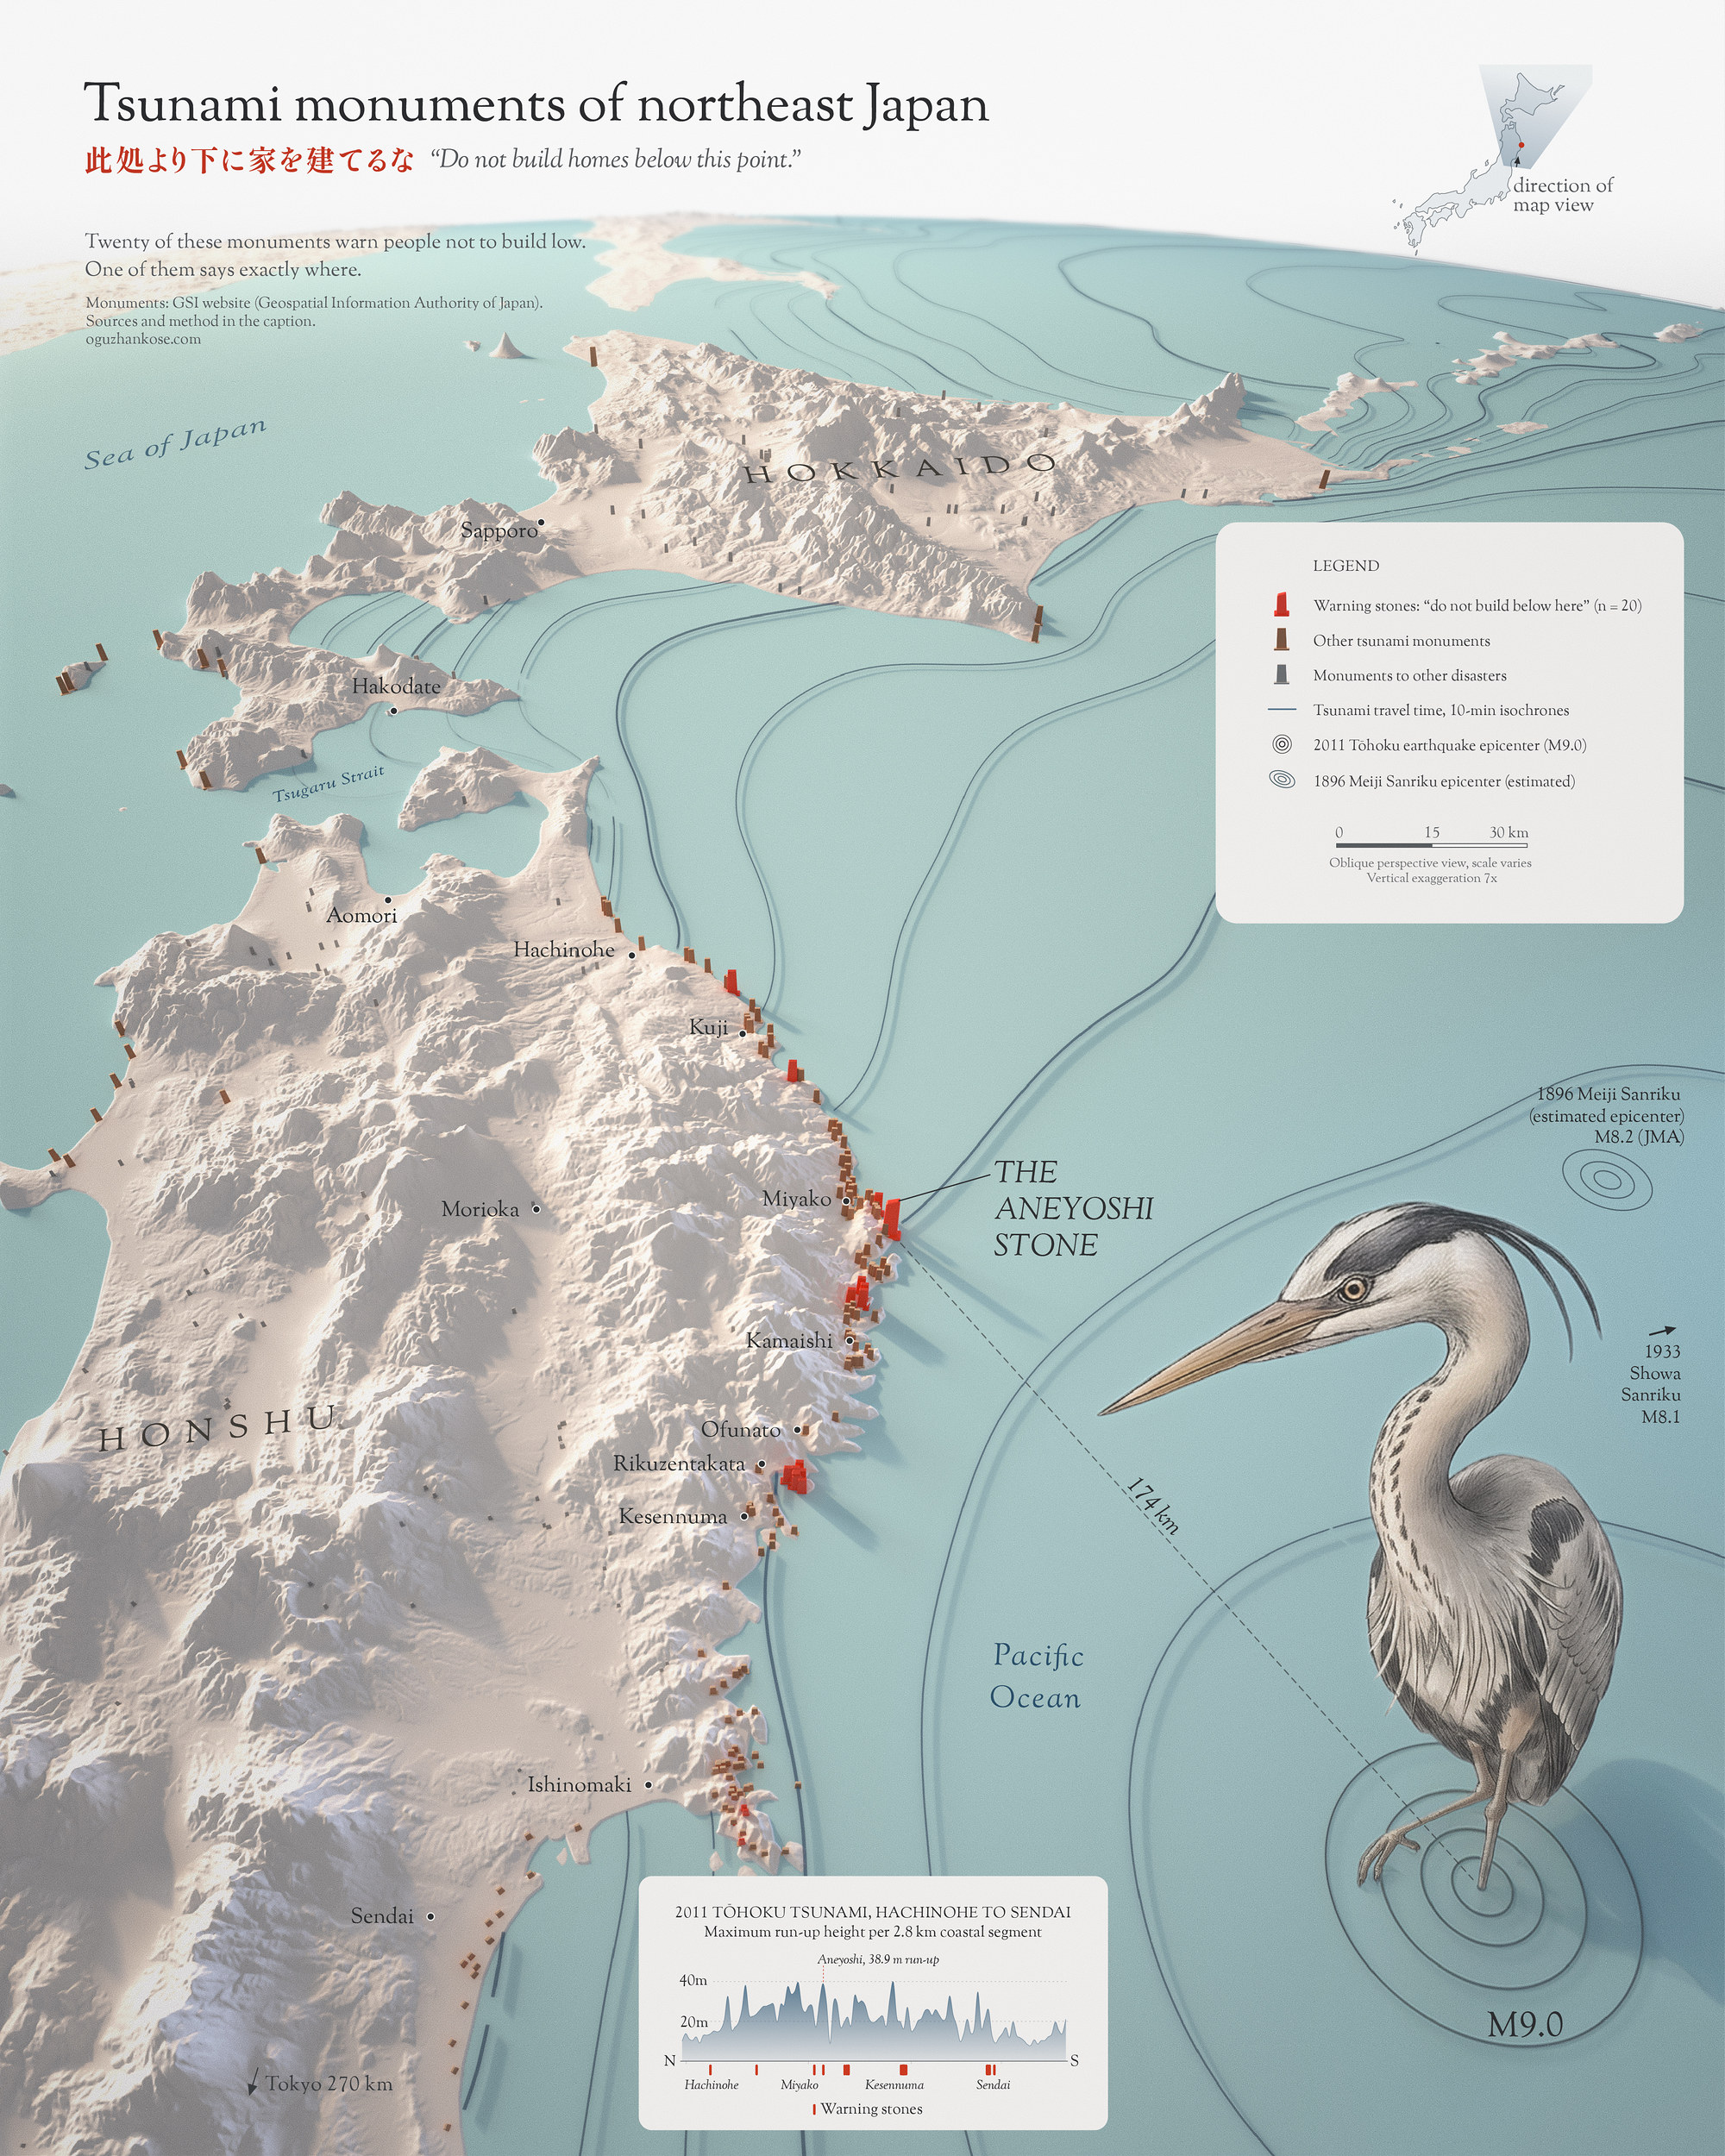
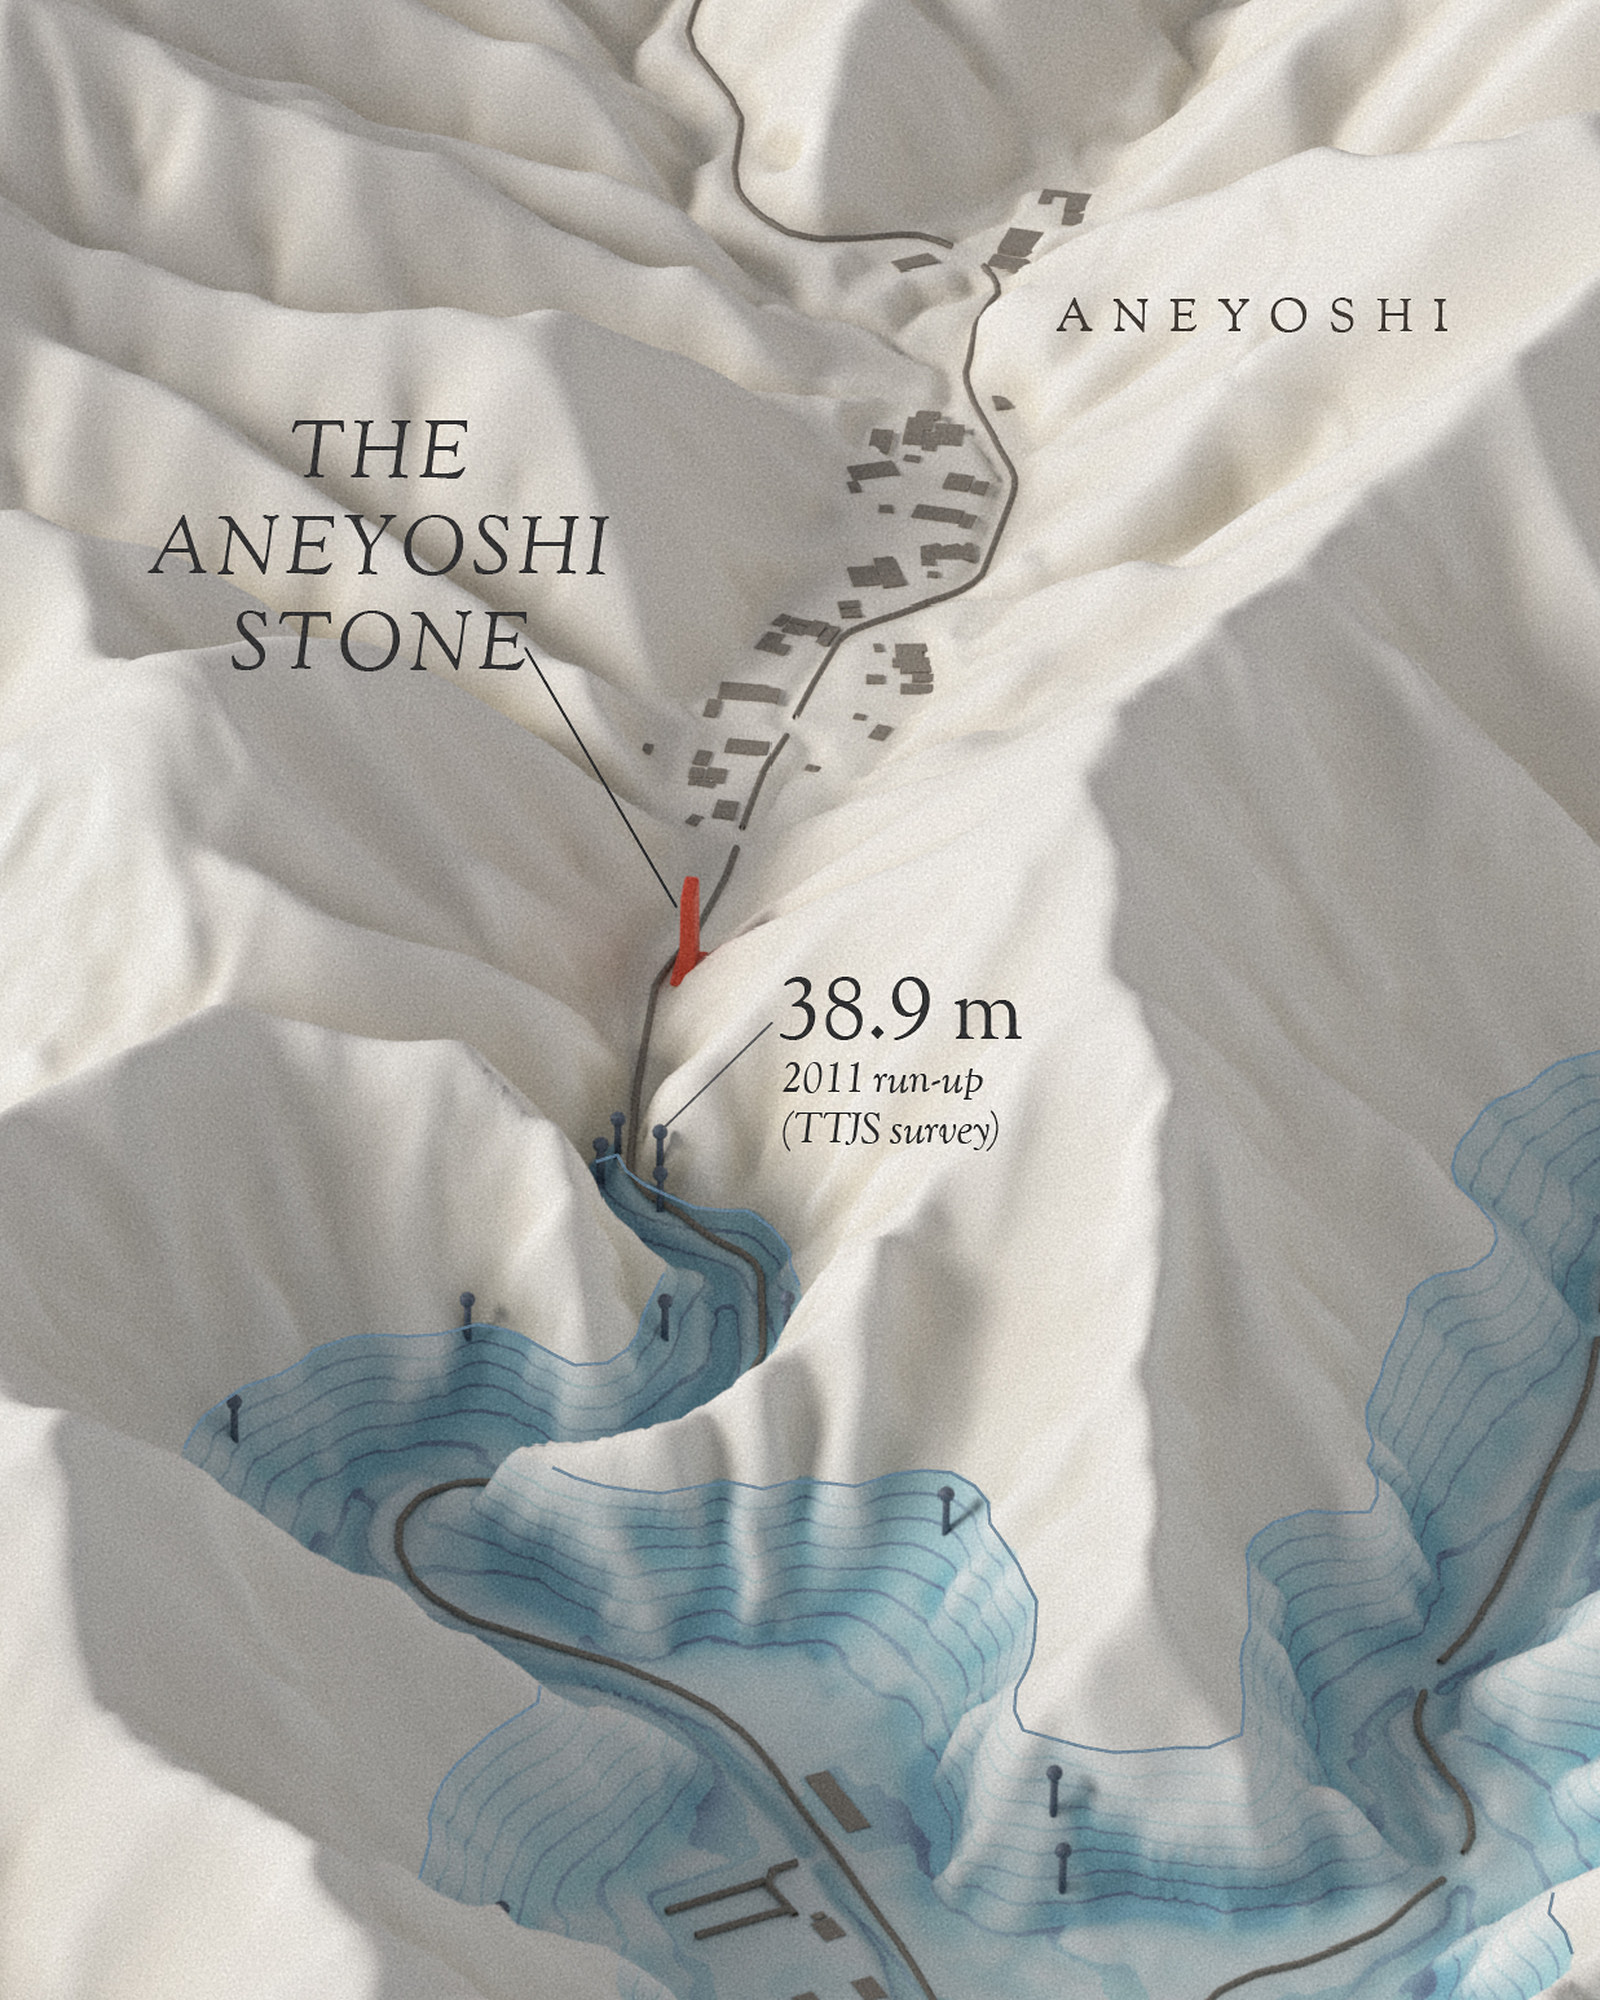
After the 1933 tsunami, a stone was set on the slope of the Aneyoshi valley, near Miyako: “Do not build homes below this point.” In 2011 the sea climbed the valley and stopped short of the stone; the highest water mark measured there is 38.9 m. None of the houses above it was damaged.
Japan’s national mapping agency, the Geospatial Information Authority of Japan (GSI), has mapped natural disaster monuments (自然災害伝承碑) since 2019; its September 2026 list holds 2,481 of them. Twenty of them, all on this coast, carry a carved warning not to build or live on low ground. One of them, at Aneyoshi, says exactly where.
The sea stopped short of the stone
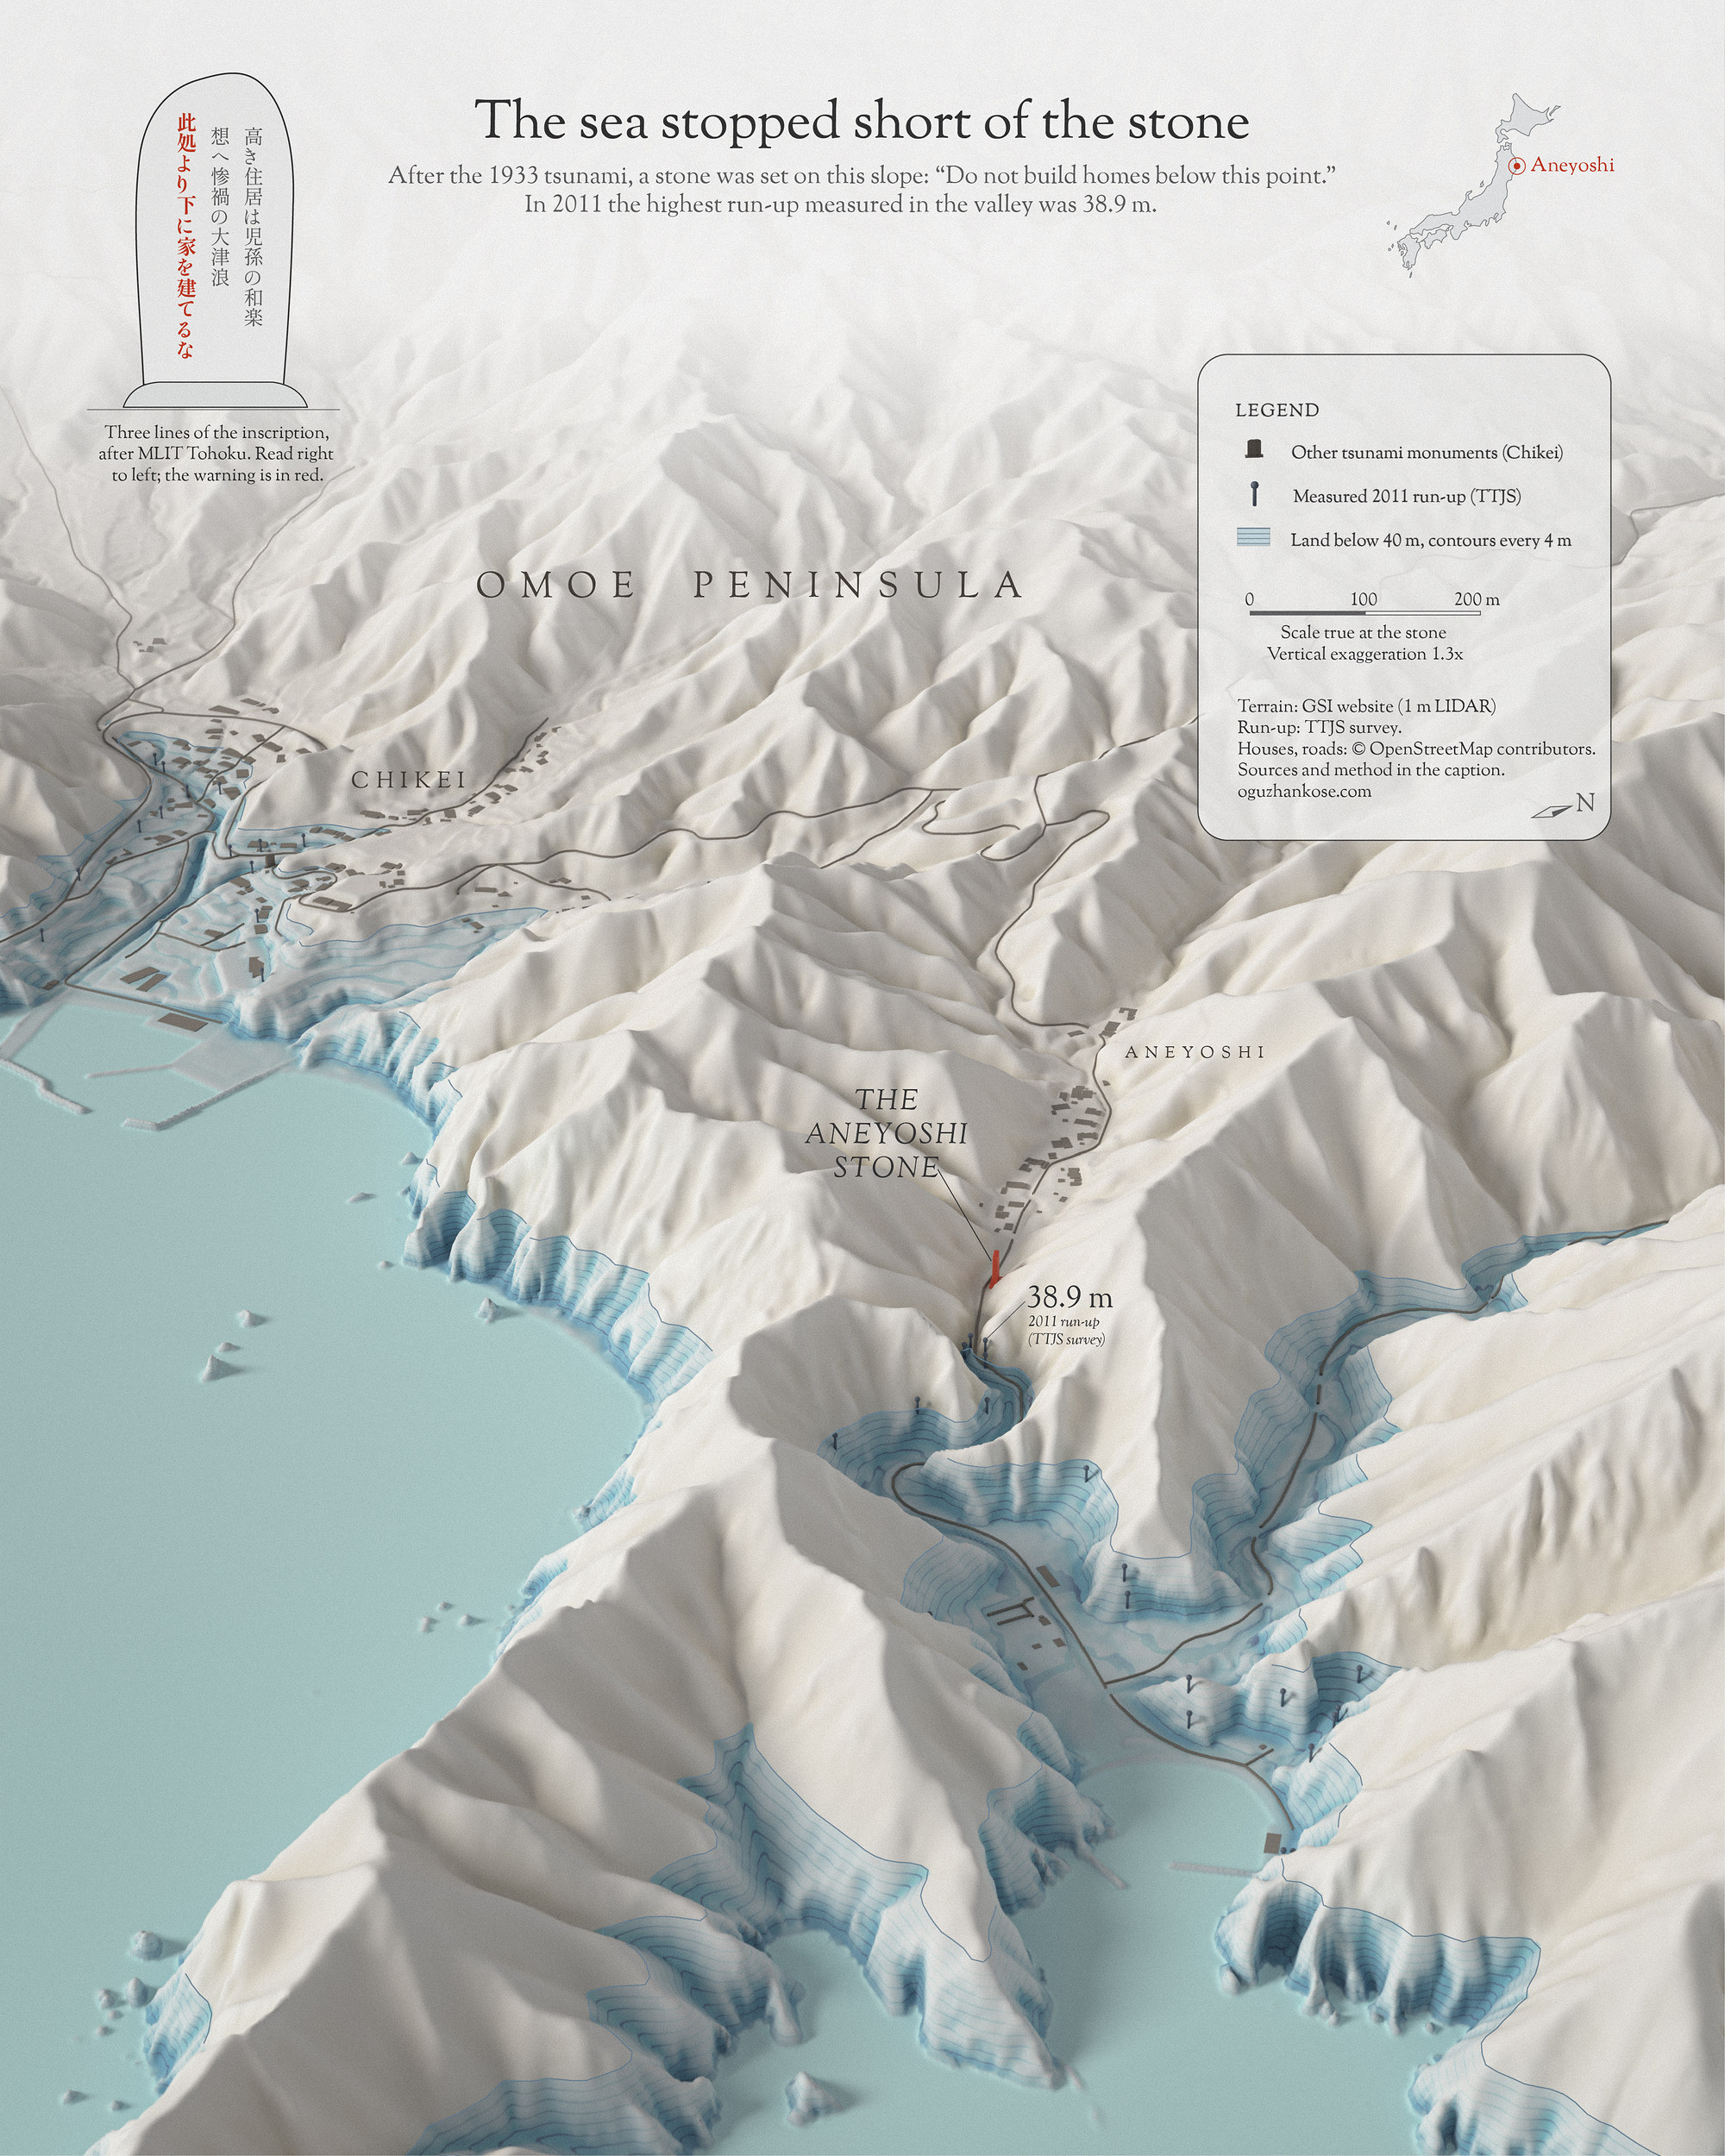
Run-up is the height above sea level that the 2011 water reached on land. All 74 survey marks in this valley (TTJT, grades A and B) lie below 40 m; the stone stands above every one of them. Marks are drawn where the survey placed them. The GSI 1 m lidar DEM puts the ground at the stone at about 53 m; published sources give 60 m (MLIT Tohoku; Miyako City). The carved lines are transcribed from the MLIT Tohoku record (stone 岩手077).
The full inscription on the stone, in English:
“High dwellings are the peace and happiness of our descendants. Remember the calamity of the great tsunamis. Do not build homes below this point. In 1896 and again in 1933 the tsunami came up to this point and the hamlet was wiped out; only two people survived the first, and four the second. However many years pass, stay on your guard.”
Making it
Day 1 was a joy to make. I wanted to see the coast at an angle, the way you’d see it flying in from the sea, and I happily spent hours getting that view to read just right. A lot of it went into the terrain: I prepared the elevation data in QGIS and Python, smoothed the land with focal statistics so the relief stays calm, and blended a little of the raw detail back in so the ridges don’t go soft. The scene was built and rendered in Blender (Cycles), with the terrain as real displacement and every monument placed from its GSI coordinates. The tsunami travel-time lines are computed, not drawn: wave speed from water depth, cell by cell. The heron is illustrative. Then my favorite part, the layout, finished by hand in Illustrator and Photoshop. What stays with me is how short the warning is. Just one line on the stone, “Do not build homes below this point,” and almost eighty years later the village was still living by it.
Data and method
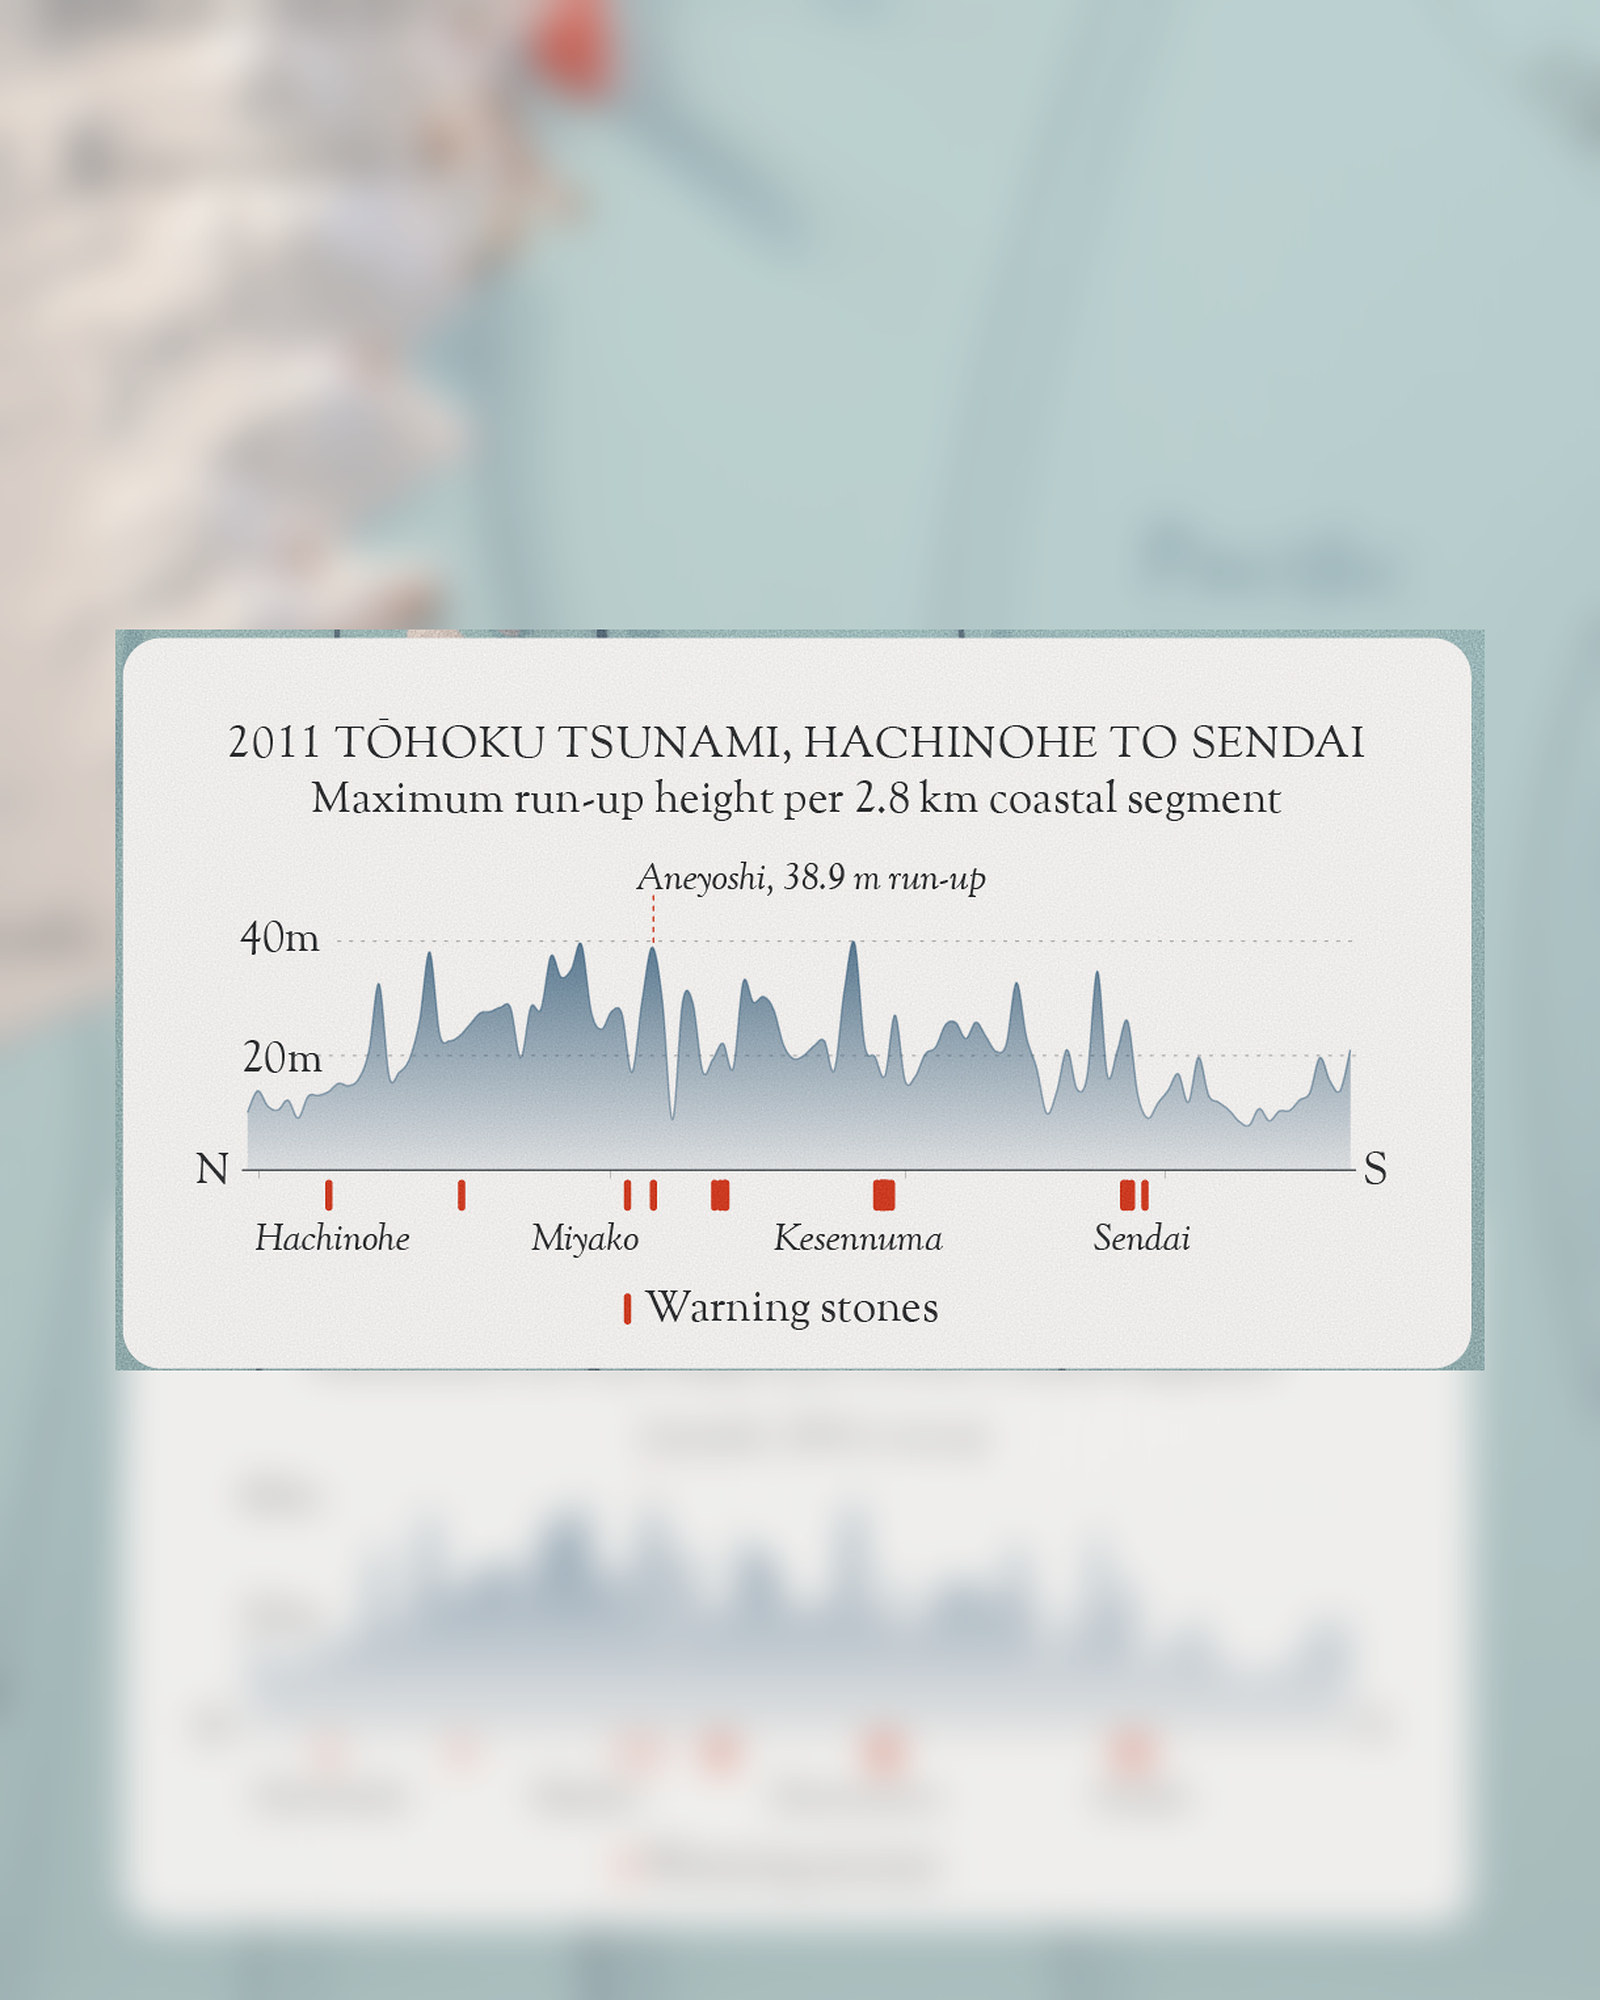
Red stones are the twenty that warn not to build low; brown, other tsunami monuments; gray, monuments to other disasters. The wave lines show tsunami travel time from the 2011 epicenter at 10-minute intervals: wave speed is derived from water depth with the shallow-water formula on a grid of about 4 km, from a point source at the JMA epicenter, and the result is smoothed. They show timing only; they do not model the 2011 rupture. The chart gives the highest measured 2011 water mark in each 2.8 km band of latitude, north to south (TTJT survey, grades A and B). Relief is vertically exaggerated seven times on the coast map and 1.3 times in the Aneyoshi valley. Rendered in Blender (Cycles); layout in Python, Illustrator and Photoshop.
Sources: Monuments: Geospatial Information Authority of Japan (GSI), 自然災害伝承碑 data, 24 Sep 2026 edition, processed. 2011 run-up: 2011 Tohoku Earthquake Tsunami Joint Survey Group (TTJT), release 20121229, coastal.jp/ttjt; Iwate Prefecture via the Cabinet Office. Epicenters: JMA (1896 after the Utsu catalogue). Relief: Copernicus GLO-90 (coast map); GSI 1 m lidar DEM via UN Smart Maps Group (Aneyoshi). Water depth: AWS Terrain Tiles. Coast: Natural Earth. Houses and roads: © OpenStreetMap contributors (ODbL). Fonts: Strabon Goudy (Sorts Mill Goudy, OFL), Shippori Mincho (OFL).