Between 09:00 on 13 October and 09:00 on 15 October, Istanbul had 48 hours of remarkably uneven rain.
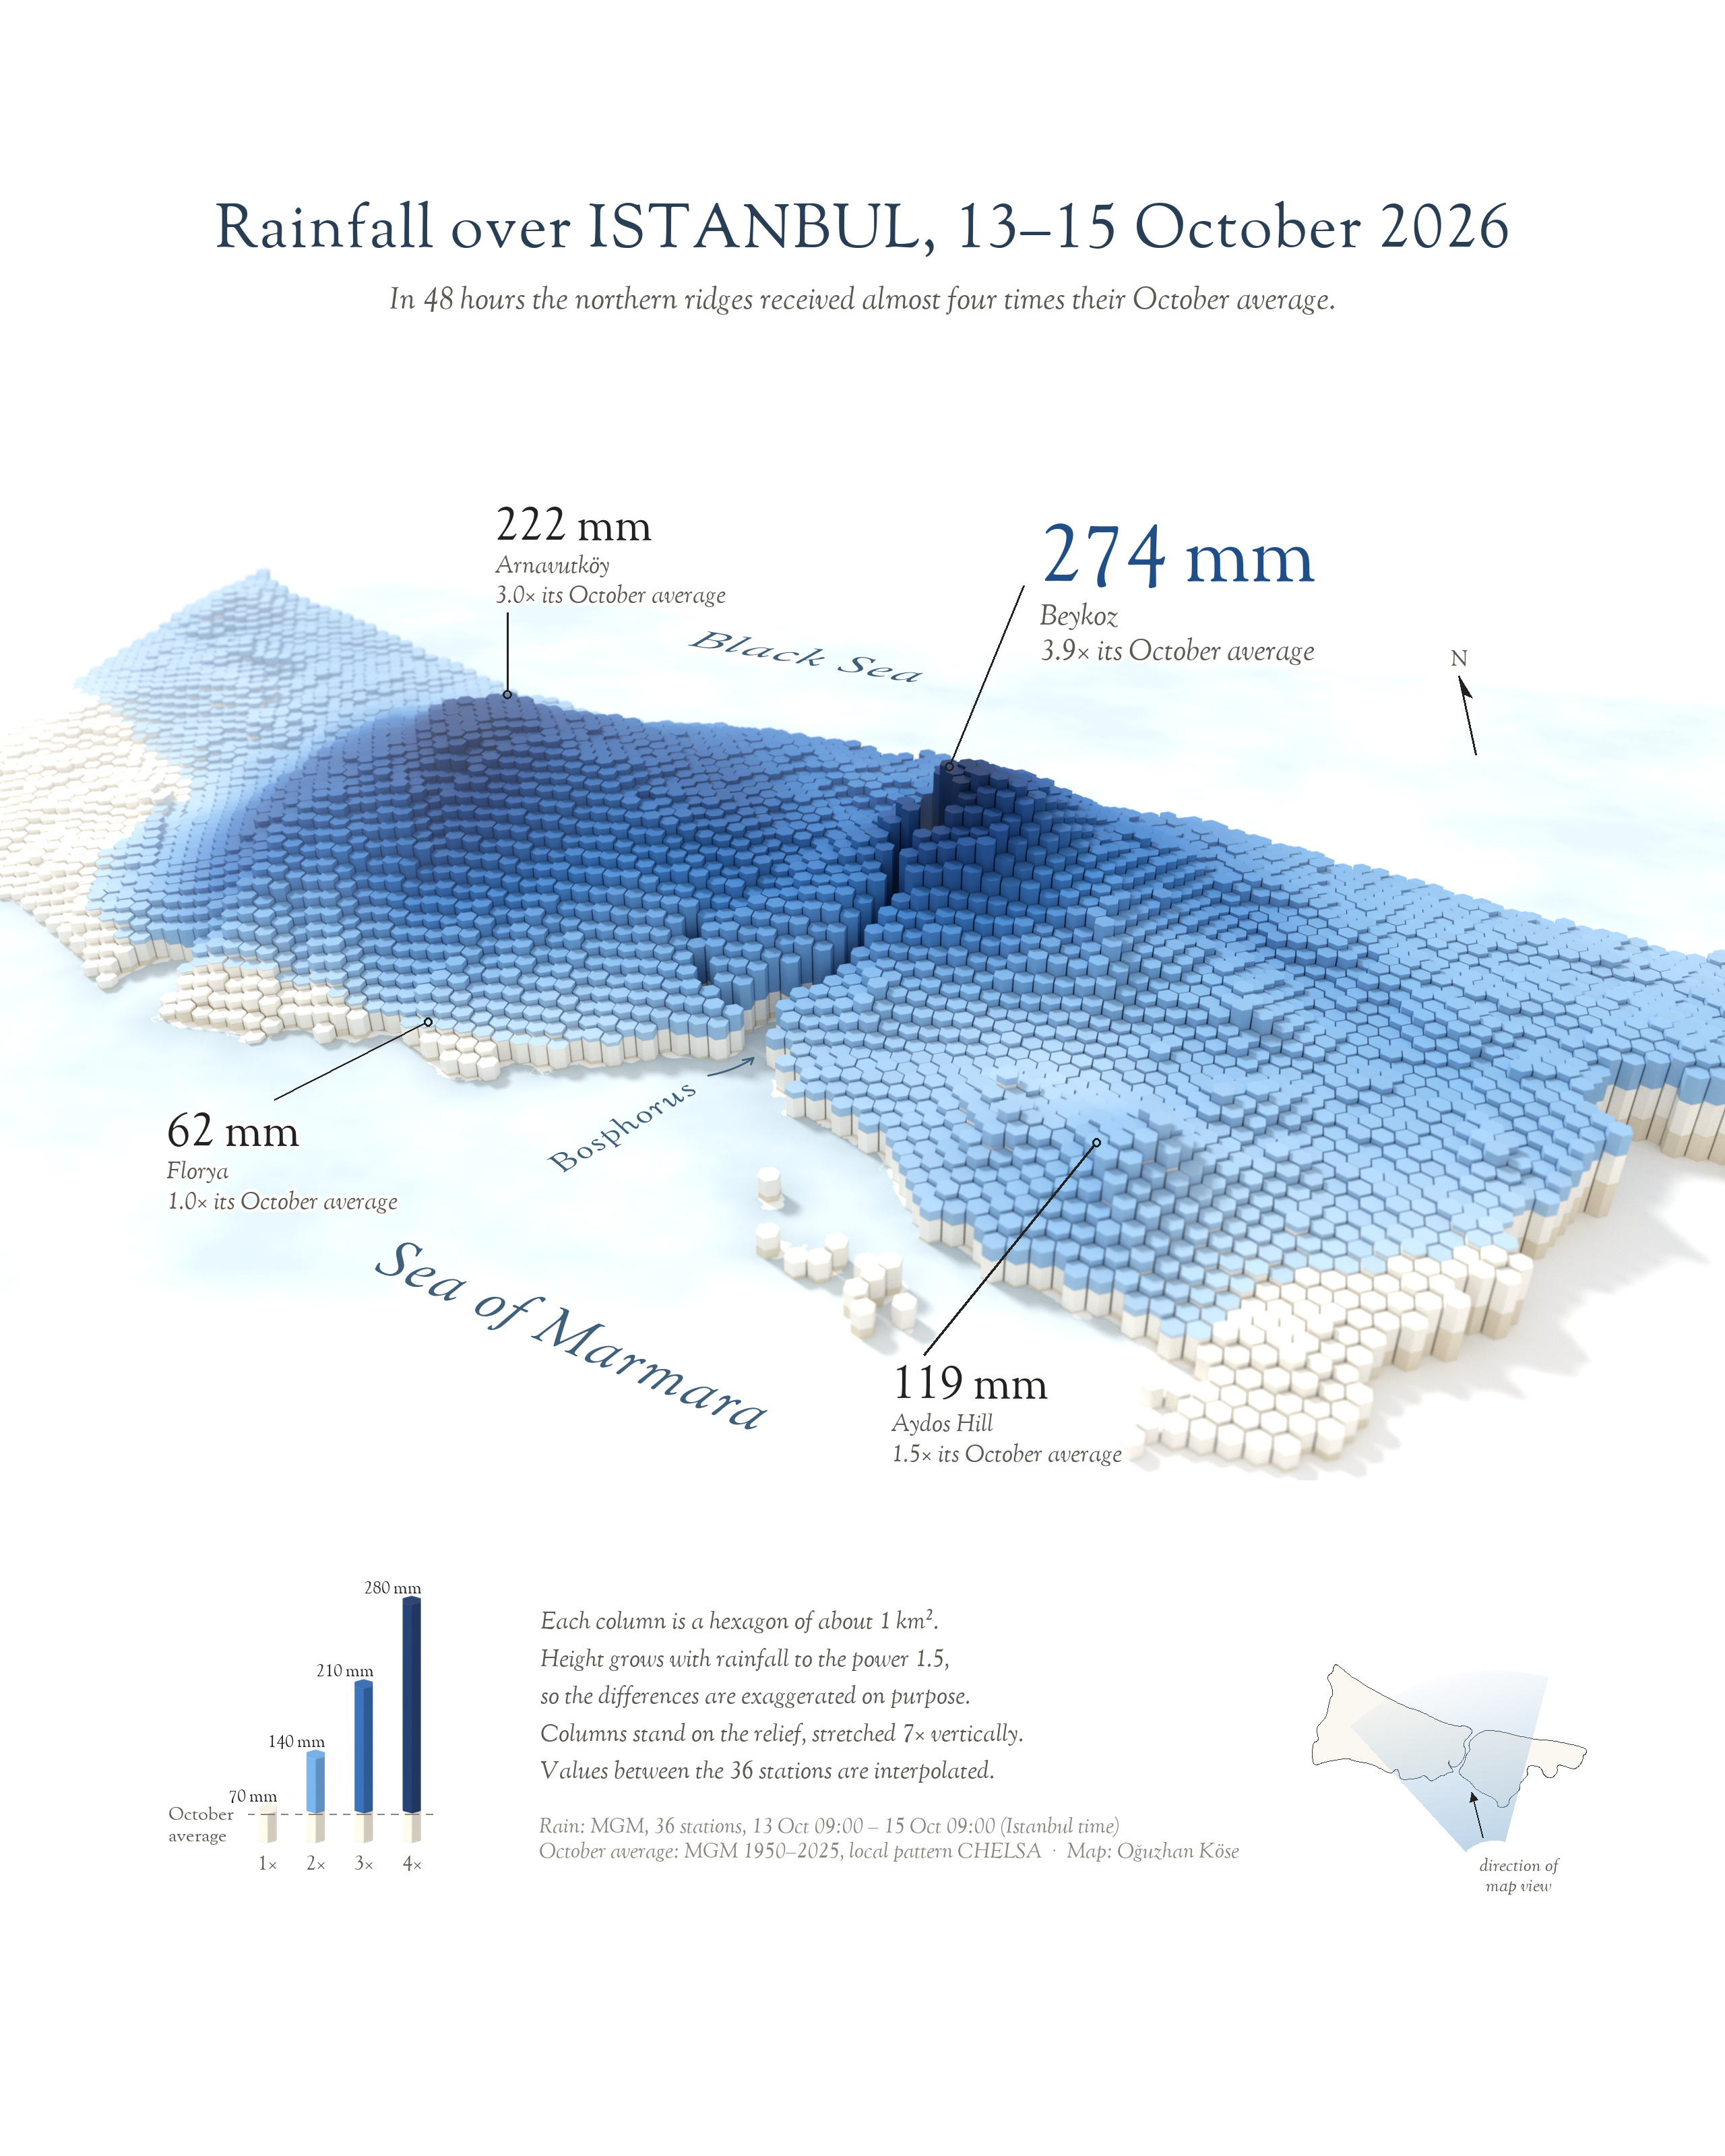
The station in Beykoz, on the Bosphorus, recorded 274 mm, close to four times the October average for that part of the city. Arnavutköy (222 mm) and Sarıyer (208 mm) were not far behind. About 30 km away on the Marmara coast, Florya measured 62 mm, roughly a normal October. Same city, same two days, more than four times the rain.
I wanted to see how that contrast unfolds across the city, so I turned the totals from 36 weather stations into a field of hexagon columns.
How to read the map
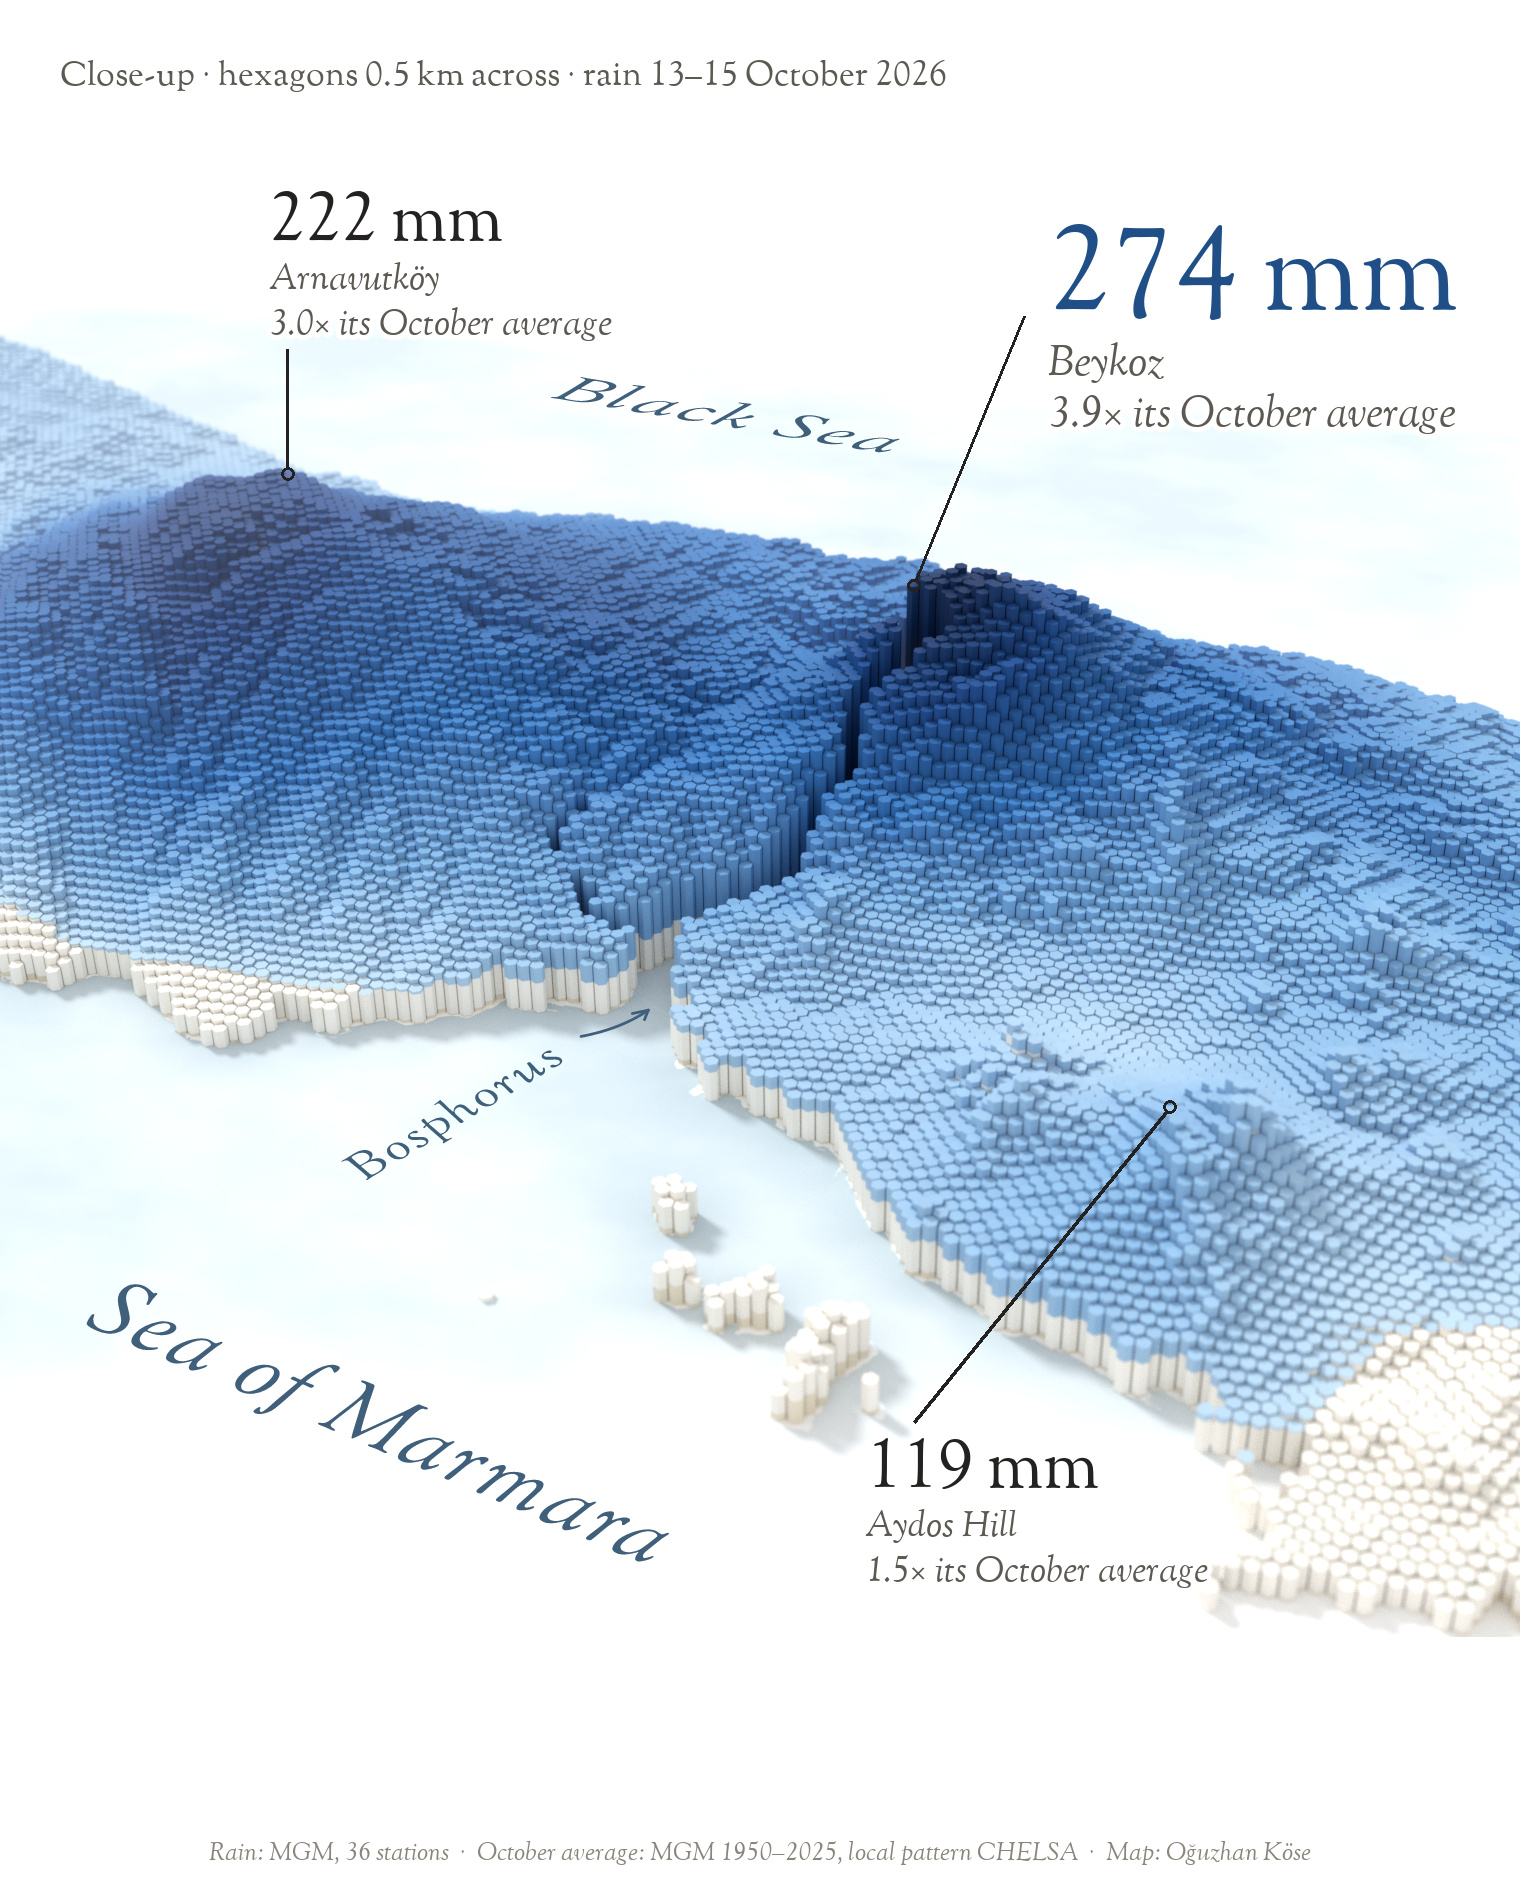
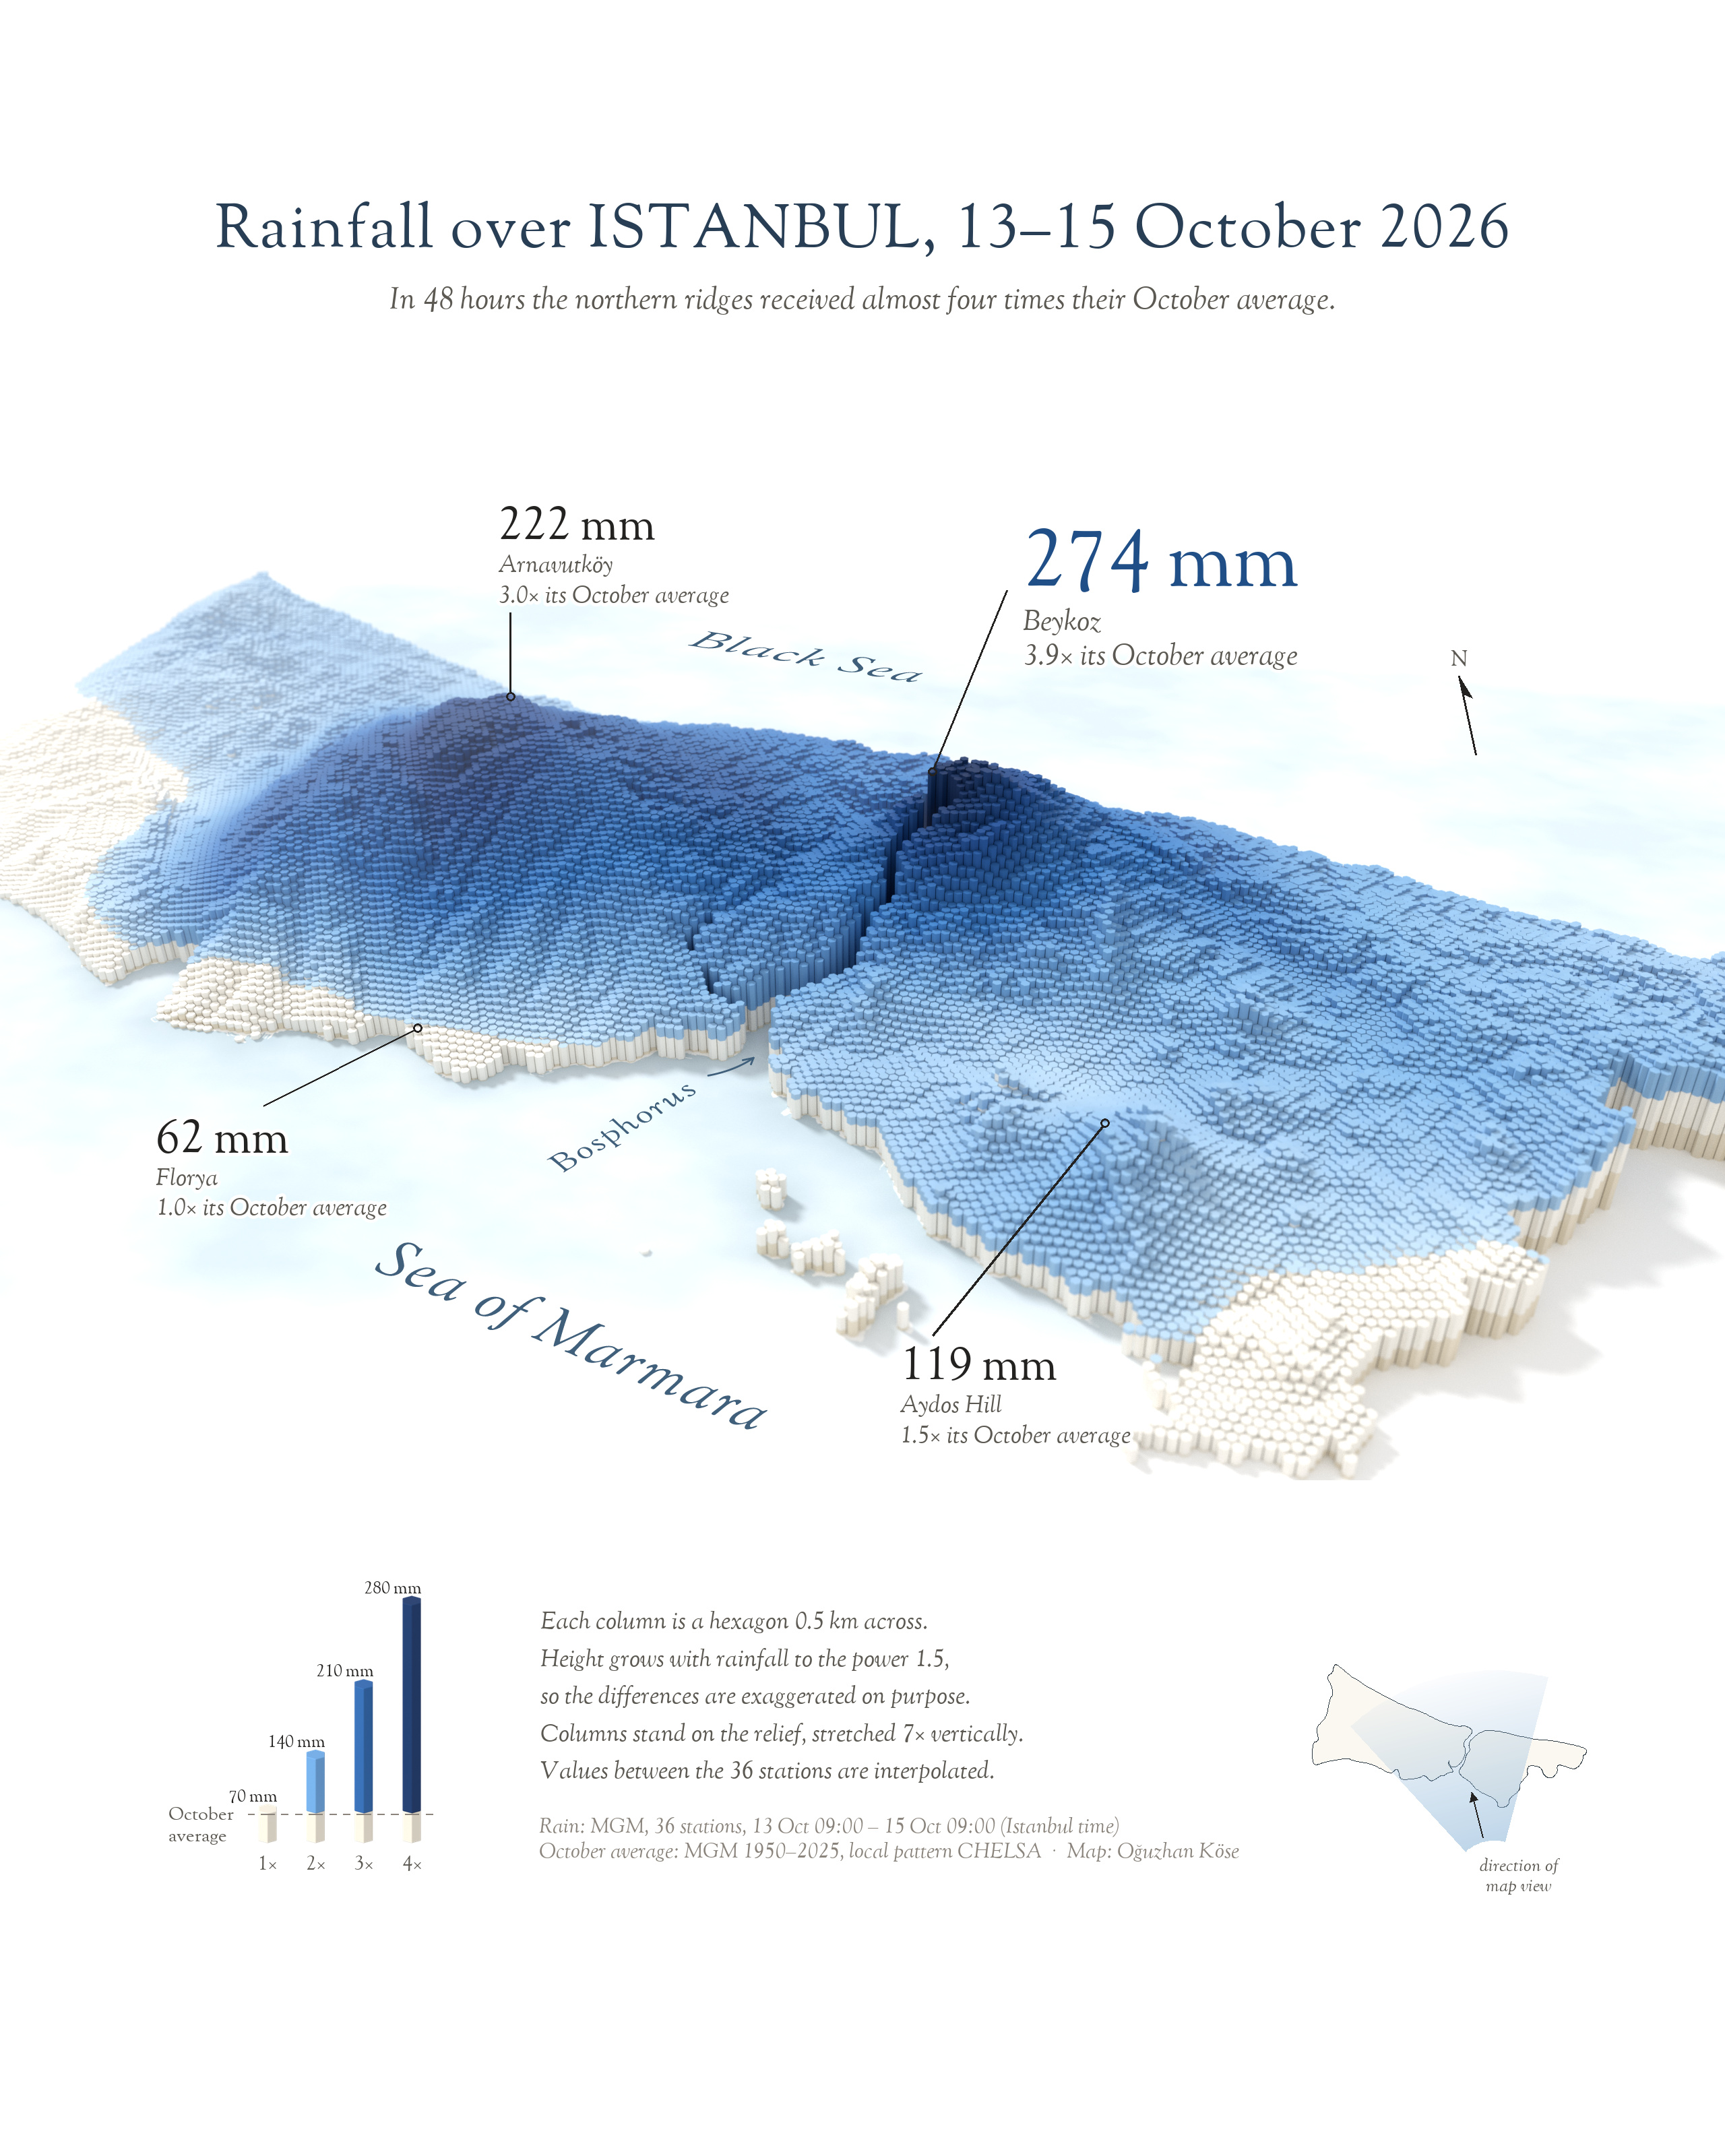
Each column is a hexagon of about 1 km², and its full height is all the rain that fell there in those 48 hours. The white base marks how much of that equals the long-term October average for the spot, so wherever blue rises above it, two days brought more rain than a normal October. The darker the blue, the more times the usual October fell there.
To keep the differences readable, the heights are exaggerated on purpose: a column grows with rainfall to the power 1.5, and the columns stand on the terrain, stretched seven times vertically. Between stations the values are interpolated, so they are less certain the farther a hexagon is from a station. The soft focus and the watercolour sea are style, not data.
Where the water went
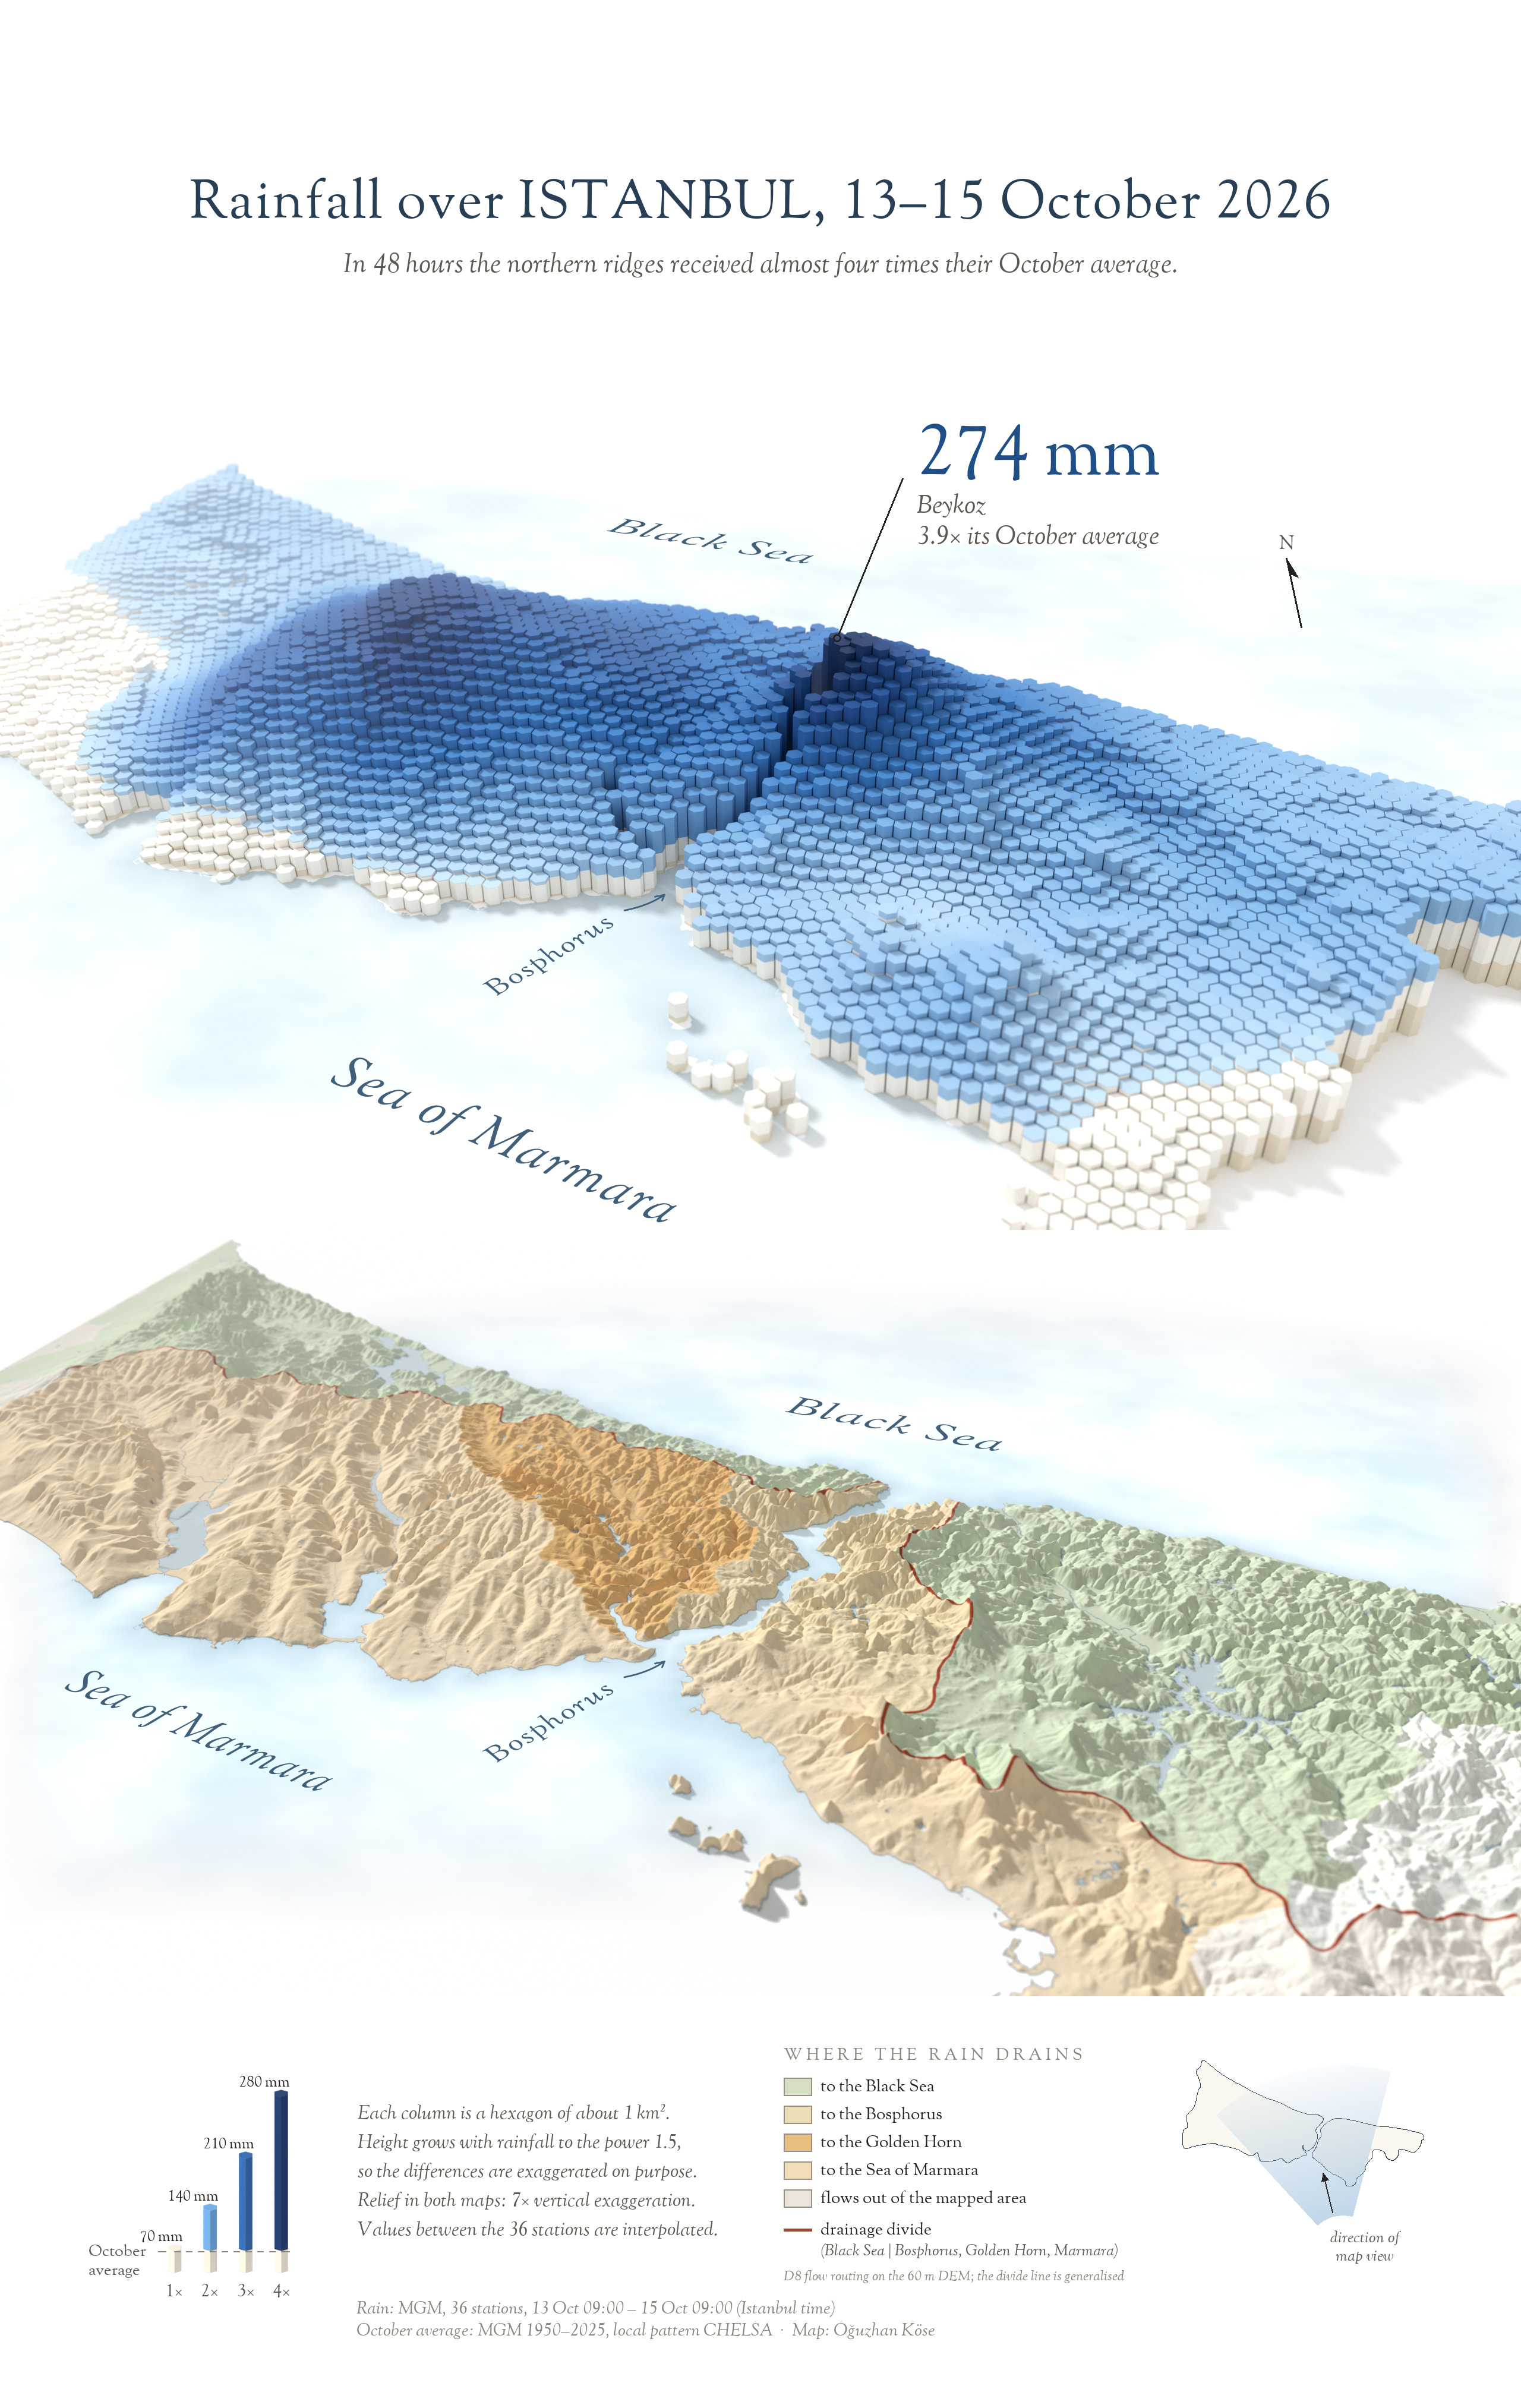
The second poster puts the land itself under the rain. Its colours show where each drop drains: to the Black Sea, the Bosphorus, the Golden Horn or the Sea of Marmara. The basins were computed from the elevation model with D8 flow routing on a 60 m grid; lakes and reservoirs were routed to their real outlets, so Büyükçekmece Lake drains to the Marmara and Ömerli to the Black Sea. The red line is the drainage divide between the Black Sea side and the Bosphorus–Golden Horn–Marmara side, generalised for display.
Data and method
- Rainfall. Measured daily totals from MGM, the Turkish State Meteorological Service, for 36 stations in Istanbul. The two 24-hour totals ending 14 and 15 October at 09:00 local time were added together. These are the latest revised values, downloaded on 16 October 2026.
- Between the stations. Thin-plate spline interpolation onto each hexagon, limited to the range actually measured. All 36 official values are used as published; a few stations differ sharply from their neighbours, which adds uncertainty locally.
- October average. MGM’s long-term October mean for Istanbul (66.3 mm, 1950–2025), spread across the city with the spatial pattern of the CHELSA V2.1 climatology (1981–2010, about 1 km). Across the city it ranges from roughly 50 to 95 mm; the legend uses 70 mm as an example.
- Terrain and water. Copernicus DEM GLO-30 (30 m), with lakes from ESA WorldCover 2021 and district boundaries from geoBoundaries (OpenStreetMap).
- Tools. Rendered in Blender; data processing and layout in Python; final touches in Illustrator and Photoshop. No generative AI.
Credits
Rainfall: MGM · Elevation: Copernicus DEM GLO-30, © DLR e.V. and Airbus, provided under COPERNICUS by the European Union and ESA · October climatology: Karger et al. (2017), CHELSA V2.1, Scientific Data 4: 170122 · Lakes: ESA WorldCover 2021 (CC BY 4.0) · Boundaries: geoBoundaries, © OpenStreetMap contributors (ODbL).
Not an official warning. Please follow AFAD and AKOM for current information.