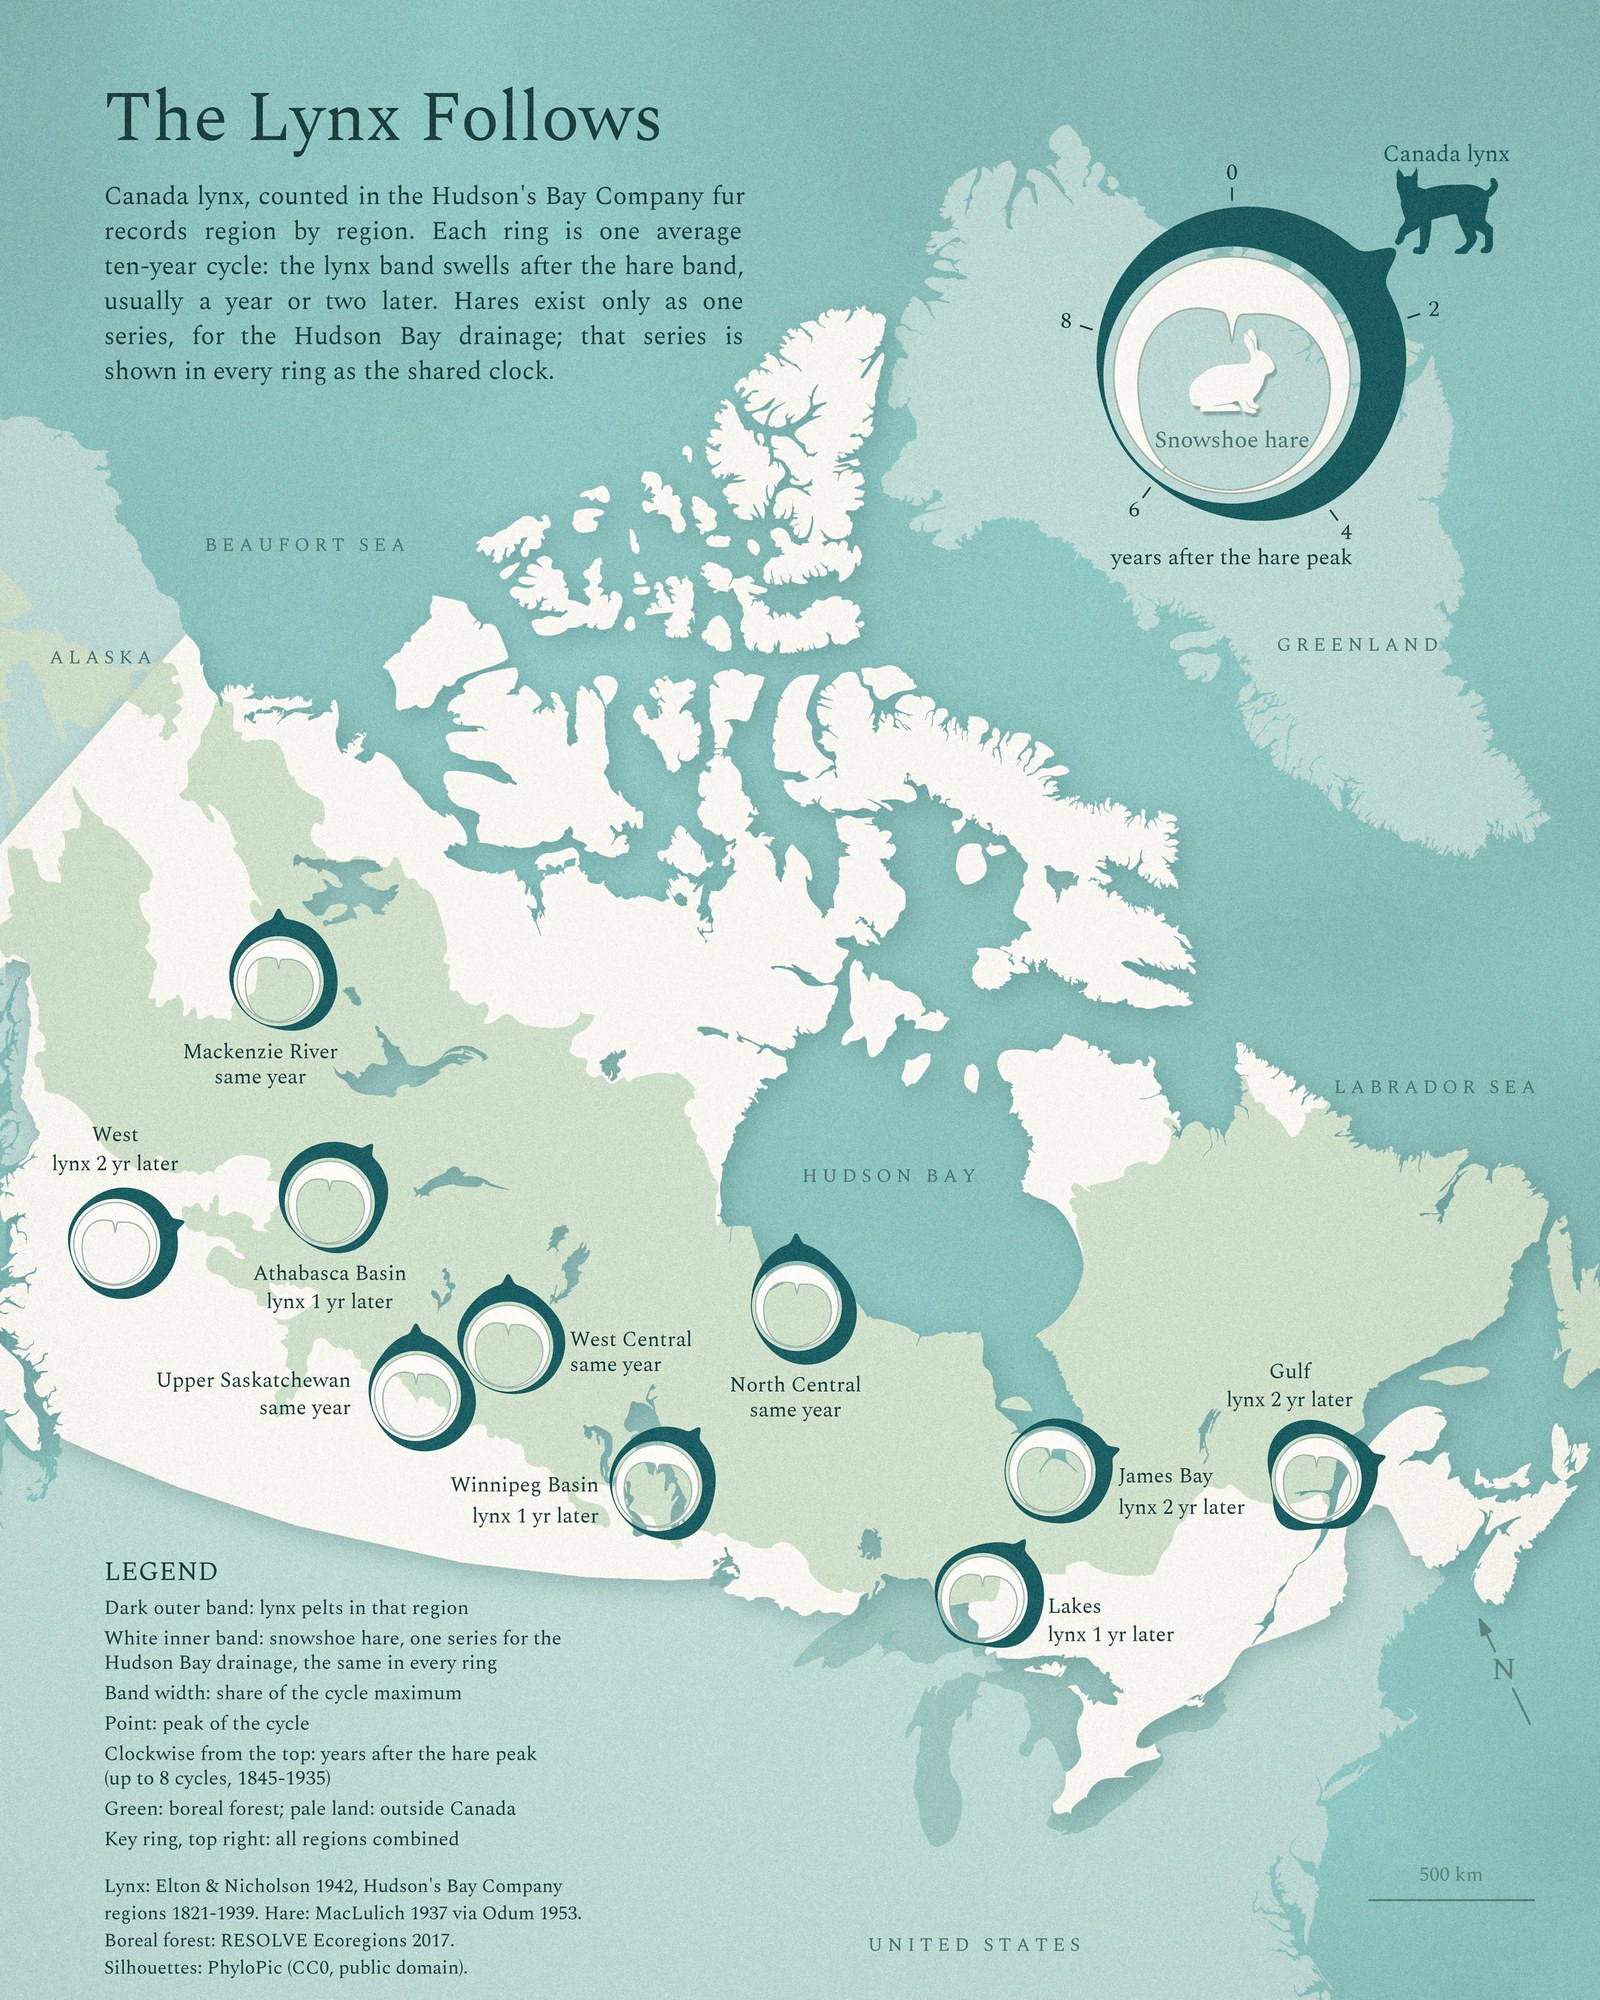
Day 13 is Interactions, and I wanted a real one: two animals that change each other’s numbers. In Canada’s boreal forest, snowshoe hares boom and crash about every ten years. The Canada lynx that live on them follow: more hares, more lynx; then lynx and other predators, together with food shortage, drive the hares down; then the lynx starve too.
There is no big event here and no new data. This map is a case study, an exercise in one thing: a legend symbol that shows two things moving against each other in one small shape, so it can sit on a map ten times and still be read.
The symbol
Each ring is one average ten-year cycle, read clockwise from the top like a clock. The dark outer band is lynx and the white inner band is hare; a band gets thicker when there are more pelts, and a small point marks the peak. All rings are lined up on the hare peak at the top, so the question each ring answers is simple: when does the lynx peak come here? In some regions it comes in the same year as the hares, in others one or two years later.
Regional lags are not my discovery. Smith and Davis (1981) found in the lynx fur records that the cycle leads in west-central Canada and lags toward both edges. Stenseth and colleagues (2004) showed that lynx cycles are more synchronous within Pacific, Continental and Atlantic climate zones than between them. What I tried here is a way to draw it.
What the data can and can’t say
Only the lynx is regional. Charles Elton and Mary Nicholson (1942) split the Hudson’s Bay Company lynx fur returns into ten regions, 1821 to 1939, and each dark band is that region’s own lynx. The one long hare series covers the main Hudson Bay drainage. It is Hudson’s Bay Company fur returns up to 1904 and trapper questionnaires from 1905 to 1935 (MacLulich 1937, redrawn in Odum’s textbook; see Stenseth and colleagues 1997). So the white band is the same in every ring: it is the shared clock, not local hares.
These are fur counts, not animal counts. They also follow how hard people trapped, and trappers themselves depended on hares, so the dating can be off by about a year. The hare and lynx series also come from different compilations. I averaged up to eight cycles (1845 to 1935) for each ring; where a region’s records have gaps, fewer (three for Lakes and Gulf, four for West and James Bay). In the combined lynx series the lag is about one to one and a half years (one year by cross-correlation).
The regional differences are rough, and this matters for reading the map. The lag was not the same in every decade: in the 1850s and 1860s the lynx peaked three or four years after the hares, after 1900 often within a year. The western and eastern regions (West, James Bay, Lakes, Gulf) have records mostly after 1900, while Mackenzie River and the prairie regions average all eight cycles. On the same three cycles (1904, 1912, 1923), James Bay and Gulf still lag most, about two years, and the other regions between zero and about one year. So read the labels as a rough picture, not a measured wave.
Method
Each region’s lynx series and the hare series were cut into eight windows around the hare peaks (1853, 1863, 1875, 1886, 1895, 1904, 1912 and 1923), scaled to each cycle’s own maximum and averaged. The rings sit at representative trading posts of each region, checked against the 1897 region map in Elton and Nicholson. The boreal forest is the RESOLVE Ecoregions 2017 biome.
References
- Elton, C. and Nicholson, M. (1942). The ten-year cycle in numbers of the lynx in Canada. Journal of Animal Ecology 11: 215-244.
- MacLulich, D. A. (1937). Fluctuations in the numbers of the varying hare (Lepus americanus). University of Toronto Studies, Biological Series 43.
- Odum, E. P. (1953). Fundamentals of Ecology. W. B. Saunders, Philadelphia.
- Stenseth, N. C. et al. (1997). Population regulation in snowshoe hare and Canadian lynx: asymmetric food web configurations between hare and lynx. PNAS 94: 5147-5152.
- Smith, C. H. and Davis, J. M. (1981). A spatial analysis of wildlife’s ten-year cycle. Journal of Biogeography 8: 27-35.
- Stenseth, N. C. et al. (2004). The effect of climatic forcing on population synchrony and genetic structuring of the Canadian lynx. PNAS 101: 6056-6061.
- Krebs, C. J., Boonstra, R. and Boutin, S. (2018). Using experimentation to understand the 10-year snowshoe hare cycle in the boreal forest of North America. Journal of Animal Ecology 87: 87-100.
- Dinerstein, E. et al. (2017). An ecoregion-based approach to protecting half the terrestrial realm. BioScience 67: 534-545 (RESOLVE Ecoregions 2017, CC BY 4.0).
- Silhouettes: PhyloPic, lynx by Margot Michaud (CC0), hare by xgirouxb (public domain).