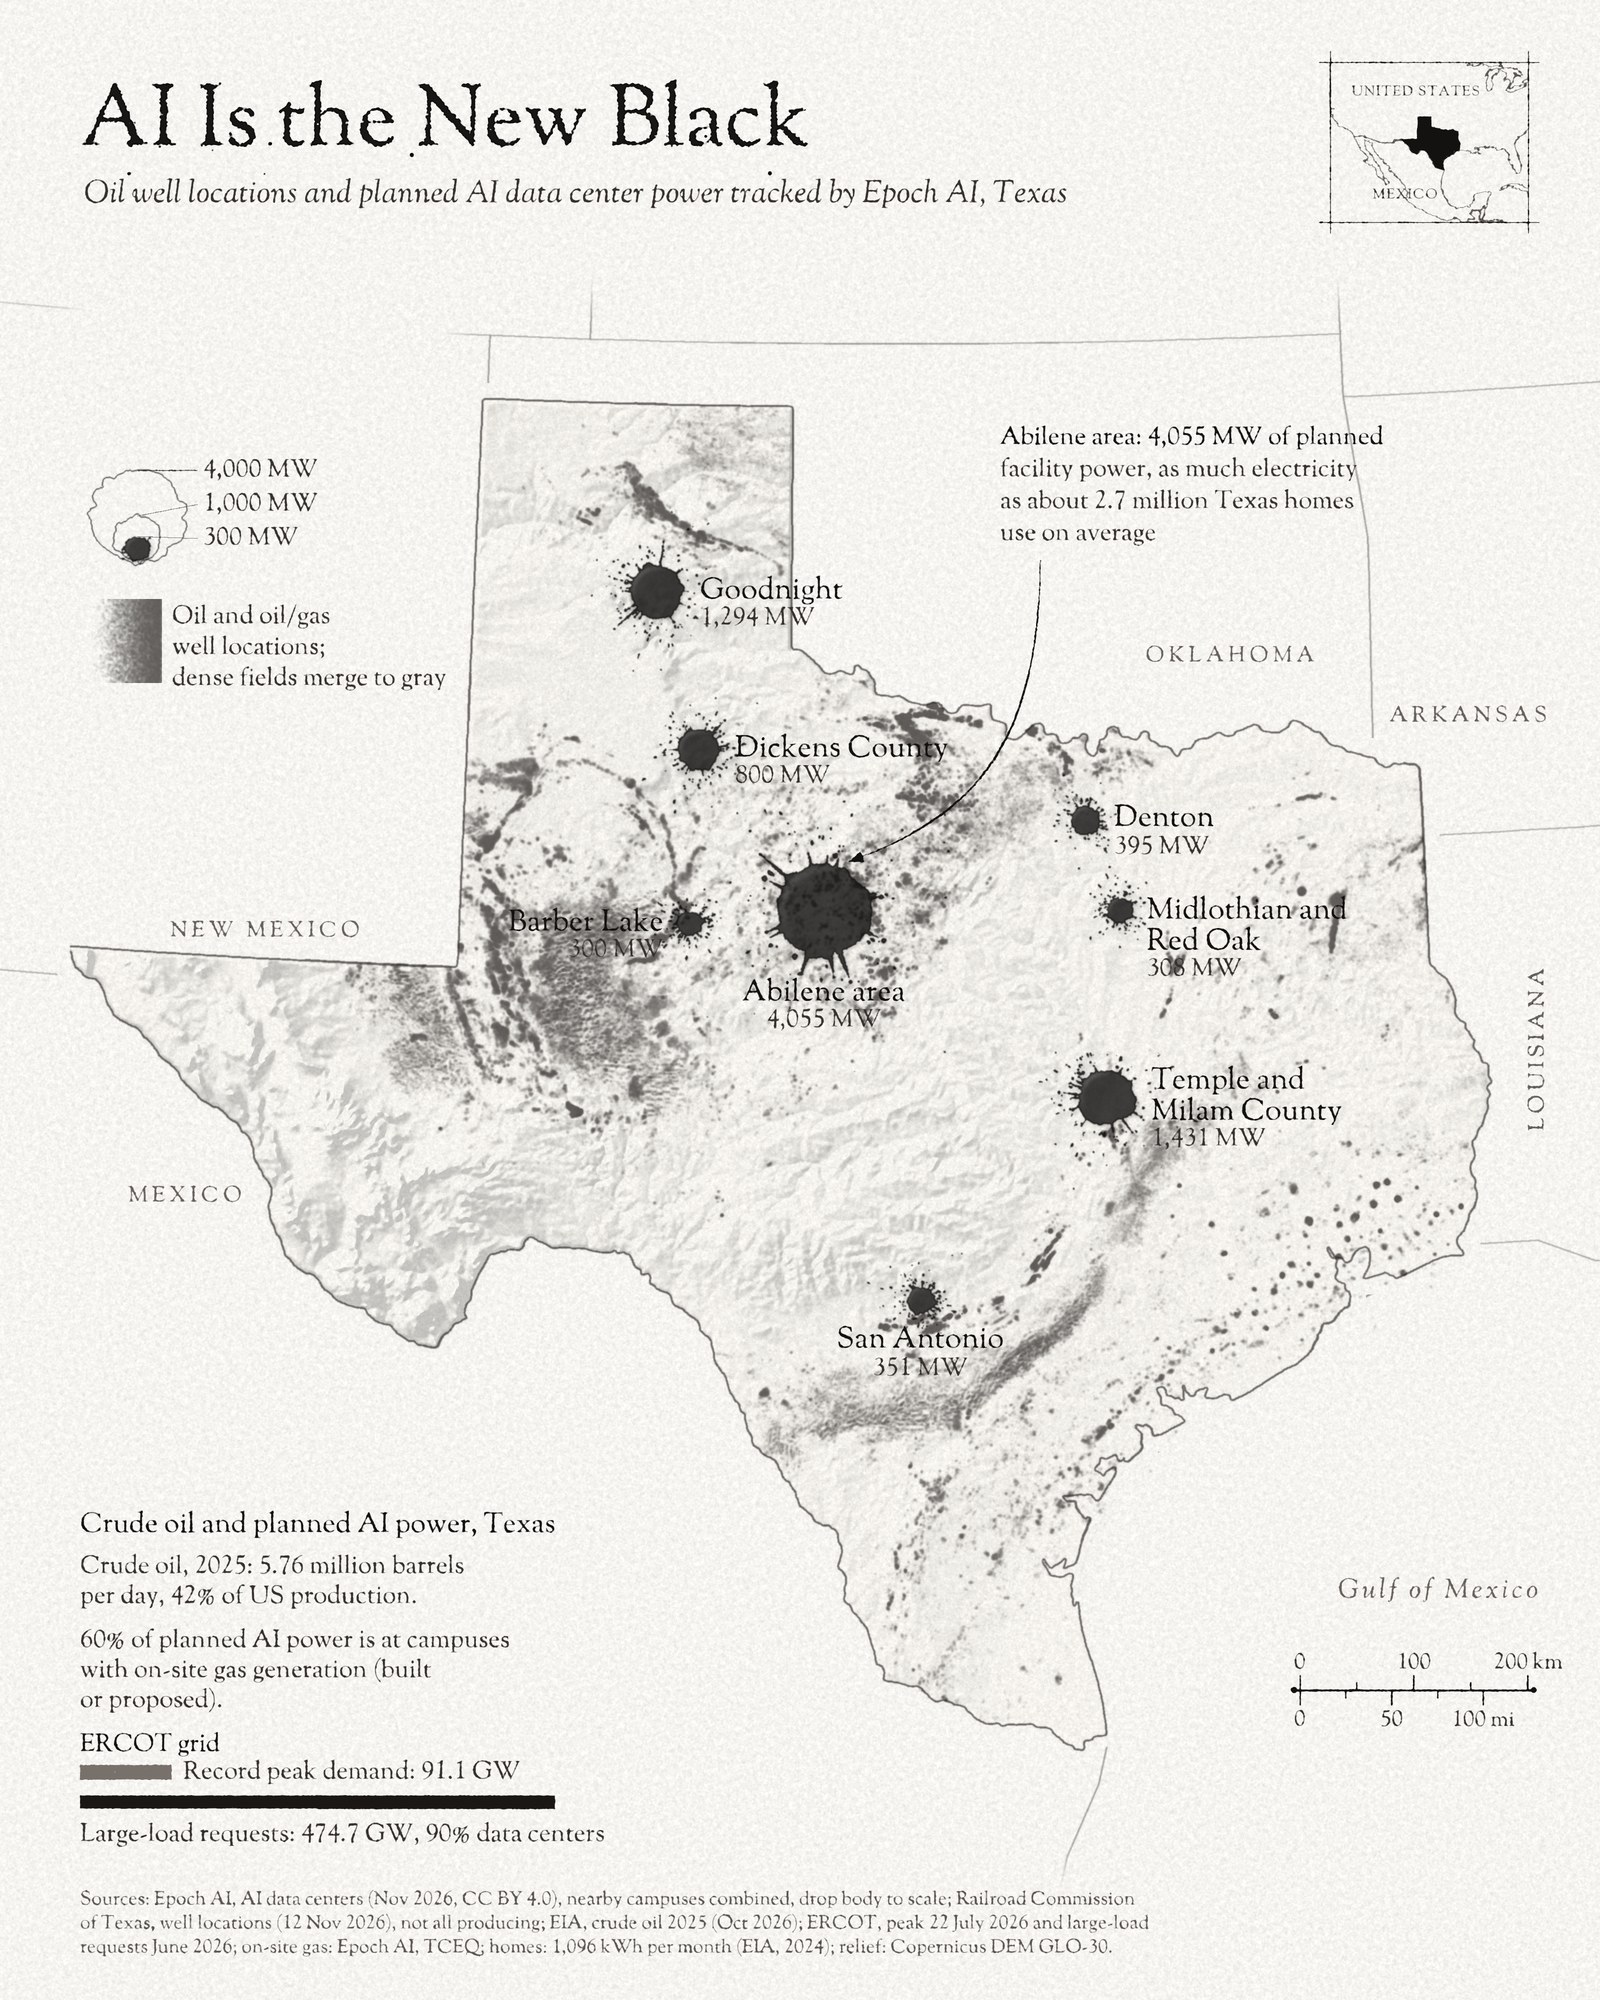
Day 12 is Power, and in Texas power still means oil. In 2025 Texas produced 5.76 million barrels of crude oil a day, 42% of all US production. The old black is still here. This map is about the new one.
The gray specks are oil and oil/gas well locations from the Railroad Commission of Texas (RRC), 338,725 of them. They’re well locations that haven’t been plugged, not producing wells. Where the fields are dense the specks merge into gray.
The black ink drops are AI data center campuses tracked by Epoch AI (November 2026), and I sized each one by its planned facility power. The area of the drop is to scale; the splashes around it are only ink and carry no data. Campuses close to each other are combined into one drop. All together that is 8.9 GW of planned power.
The biggest drop is around Abilene, three campuses with 4,055 MW of planned power between them. Running flat out, that’s as much electricity as about 2.7 million Texas homes use on average.
And some of it could run on gas. 60% of the planned power is at campuses with on-site gas generation, built or proposed.
For scale, the ERCOT grid set its record peak demand on July 22, 2026: 91.1 GW. By June 2026, large-load interconnection requests on the ERCOT grid added up to 474.7 GW, about 90% of them data centers. Those are requests to connect, not demand.
Data and method
Epoch AI doesn’t track every AI site in Texas, so the drops show only the 14 Texas campuses in its dataset. Power is planned facility power at full build: the whole campus with cooling, not only the chips. For several campuses it is Epoch’s own estimate. The on-site gas campuses are Stargate Abilene, the Crusoe Abilene Expansion, Stargate Shackelford and Goodnight. At Stargate Abilene a gas plant is built, and Oracle describes it as backup to the grid. At the other three the gas plants are proposed, with air permit applications filed with TCEQ. Goodnight is also linked directly to two wind farms. The homes comparison assumes an average Texas home uses 1,096 kWh a month (EIA, 2024) and the campuses run at full planned power around the clock. The wells are unplugged oil and oil/gas well locations, downloaded on November 12, 2026; the RRC counted 154,099 producing oil wells on September 30, 2026. Crude oil is EIA field production, including lease condensate.
References
- Epoch AI (2026). AI data centers. Data retrieved November 2026 (CC BY 4.0).
- Railroad Commission of Texas. Public GIS Viewer, well locations (oil and oil/gas wells), downloaded November 12, 2026.
- U.S. Energy Information Administration. Crude oil field production, Texas and United States, 2025 (released October 2026).
- U.S. Energy Information Administration. Electric Sales, Revenue, and Average Price, Table 5a, 2024 (average Texas home 1,096 kWh per month).
- Railroad Commission of Texas. Well Distribution Tables, September 2026 (154,099 producing oil wells).
- U.S. Energy Information Administration. Today in Energy, August 3, 2026 (ERCOT record peak demand 91.1 GW on July 22, 2026).
- POWER Magazine. Abbott Orders Full Audit of Texas Data Center Interconnection Queue, Threatens to Deny Grid Access, August 4, 2026 (ERCOT large-load requests 474.7 GW as of June 2026, about 90% data centers).
- Epoch AI. OpenAI Stargate: where the US sites stand, April 17, 2026.
- Associated Press, via WTOP. Microsoft takes over a Texas AI data center expansion after OpenAI backs away, March 27, 2026.
- The Guardian, via Yale Environment 360. Google to Use Natural Gas to Power Massive Data Center in Texas, April 7, 2026.
- Texas Commission on Environmental Quality. Air permit notices for on-site gas generation: permit 182467 (Shackelford County) and permit 182126 (Crusoe, Abilene).
- Copernicus DEM GLO-30. Produced using Copernicus WorldDEM-30 © DLR e.V. 2010-2014 and © Airbus Defence and Space GmbH 2014-2018 provided under COPERNICUS by the European Union and ESA; all rights reserved.