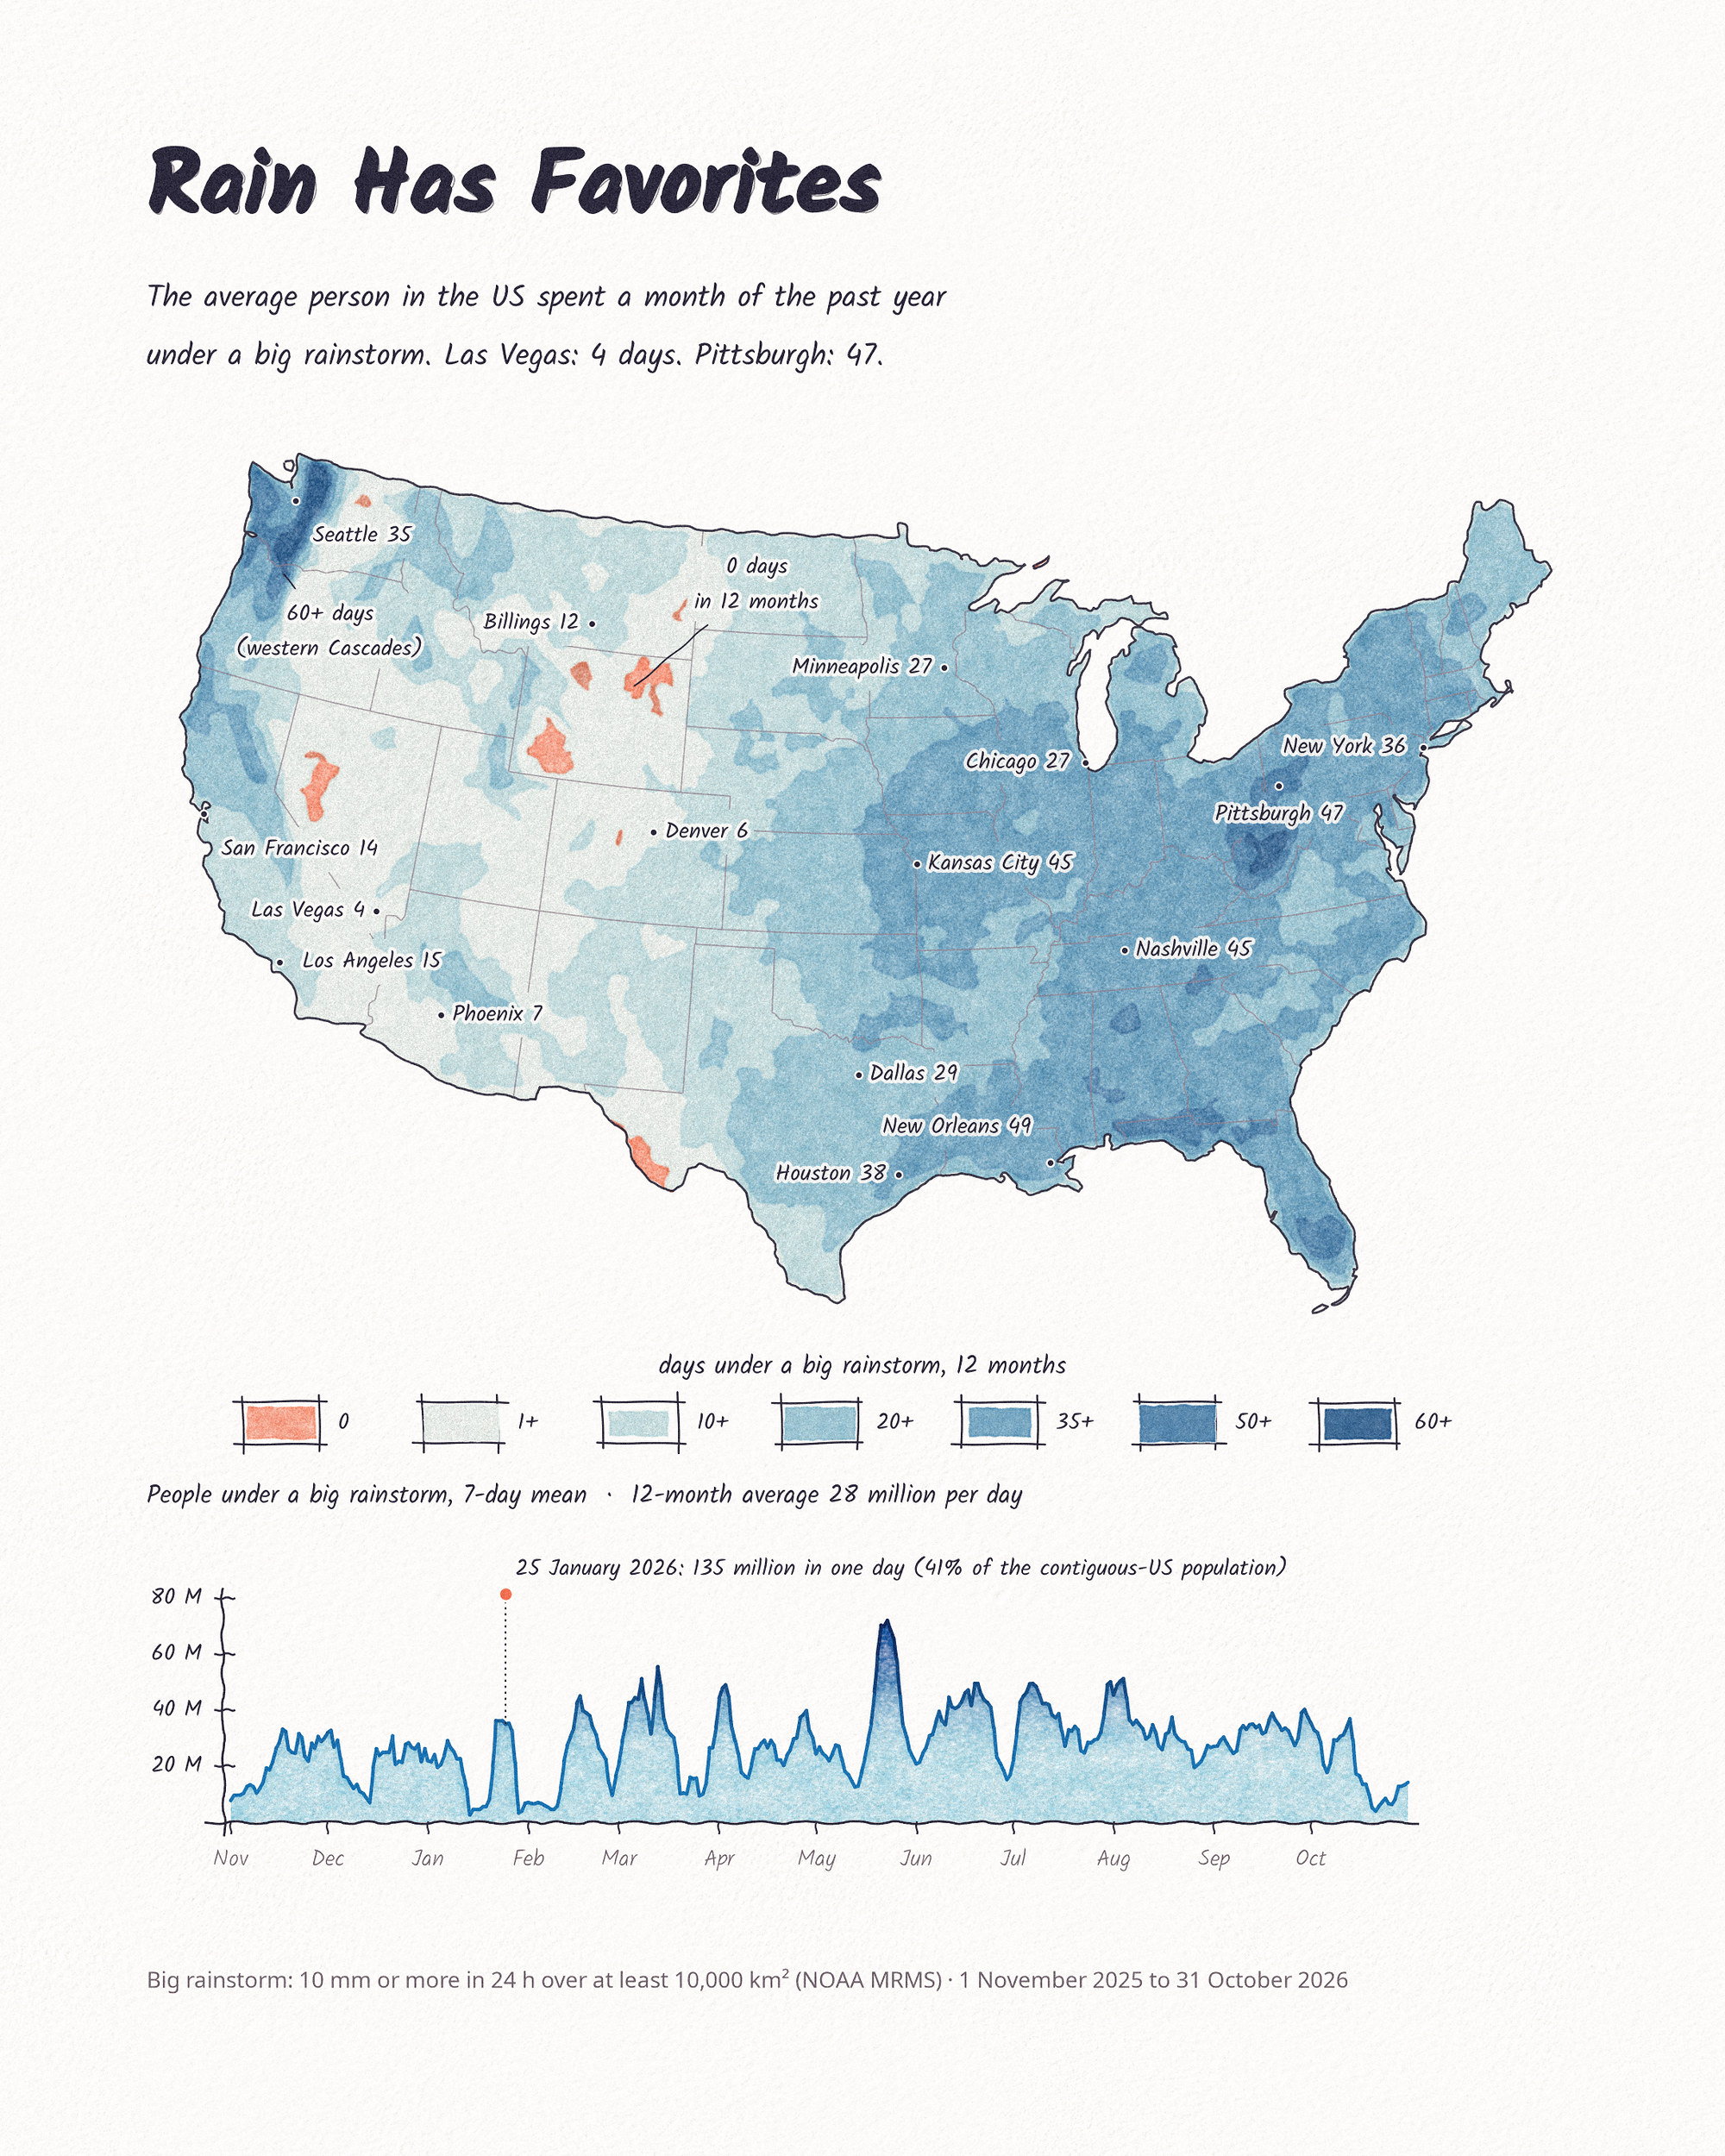
Each day’s big rain areas from NOAA radar became polygons, and each day’s polygons went onto the paper as one thin watercolor wash. The washes stack up for a year, from November 2025 to October 2026, so the places that kept getting rain are the darkest: the western Cascades, the Gulf Coast, the Ohio valley and the Appalachians. Parts of Wyoming, Nevada and west Texas had none. On 25 January 2026, 135 million people were under one at the same time.
Making it
- Big rainstorm: 10 mm (0.4 in) or more in 24 hours over a connected area of at least 10,000 km².
- Blue steps: 1, 10, 20, 35, 50 and 60+ days, each a separate wash.
- Coral: no big rainstorm all year.
- Chart: people under a big rainstorm, 7-day mean. The dot above the scale is the single-day peak, 135 million on 25 January.
- Paper and pen: the grain is a photographed watercolor sheet, and the lines have a small hand wobble. All made in Python.
- Miami: small local storms don’t reach 10,000 km², so Miami comes out low (18 days, against 55 days with 10 mm or more in PRISM) and isn’t labeled.
Germany
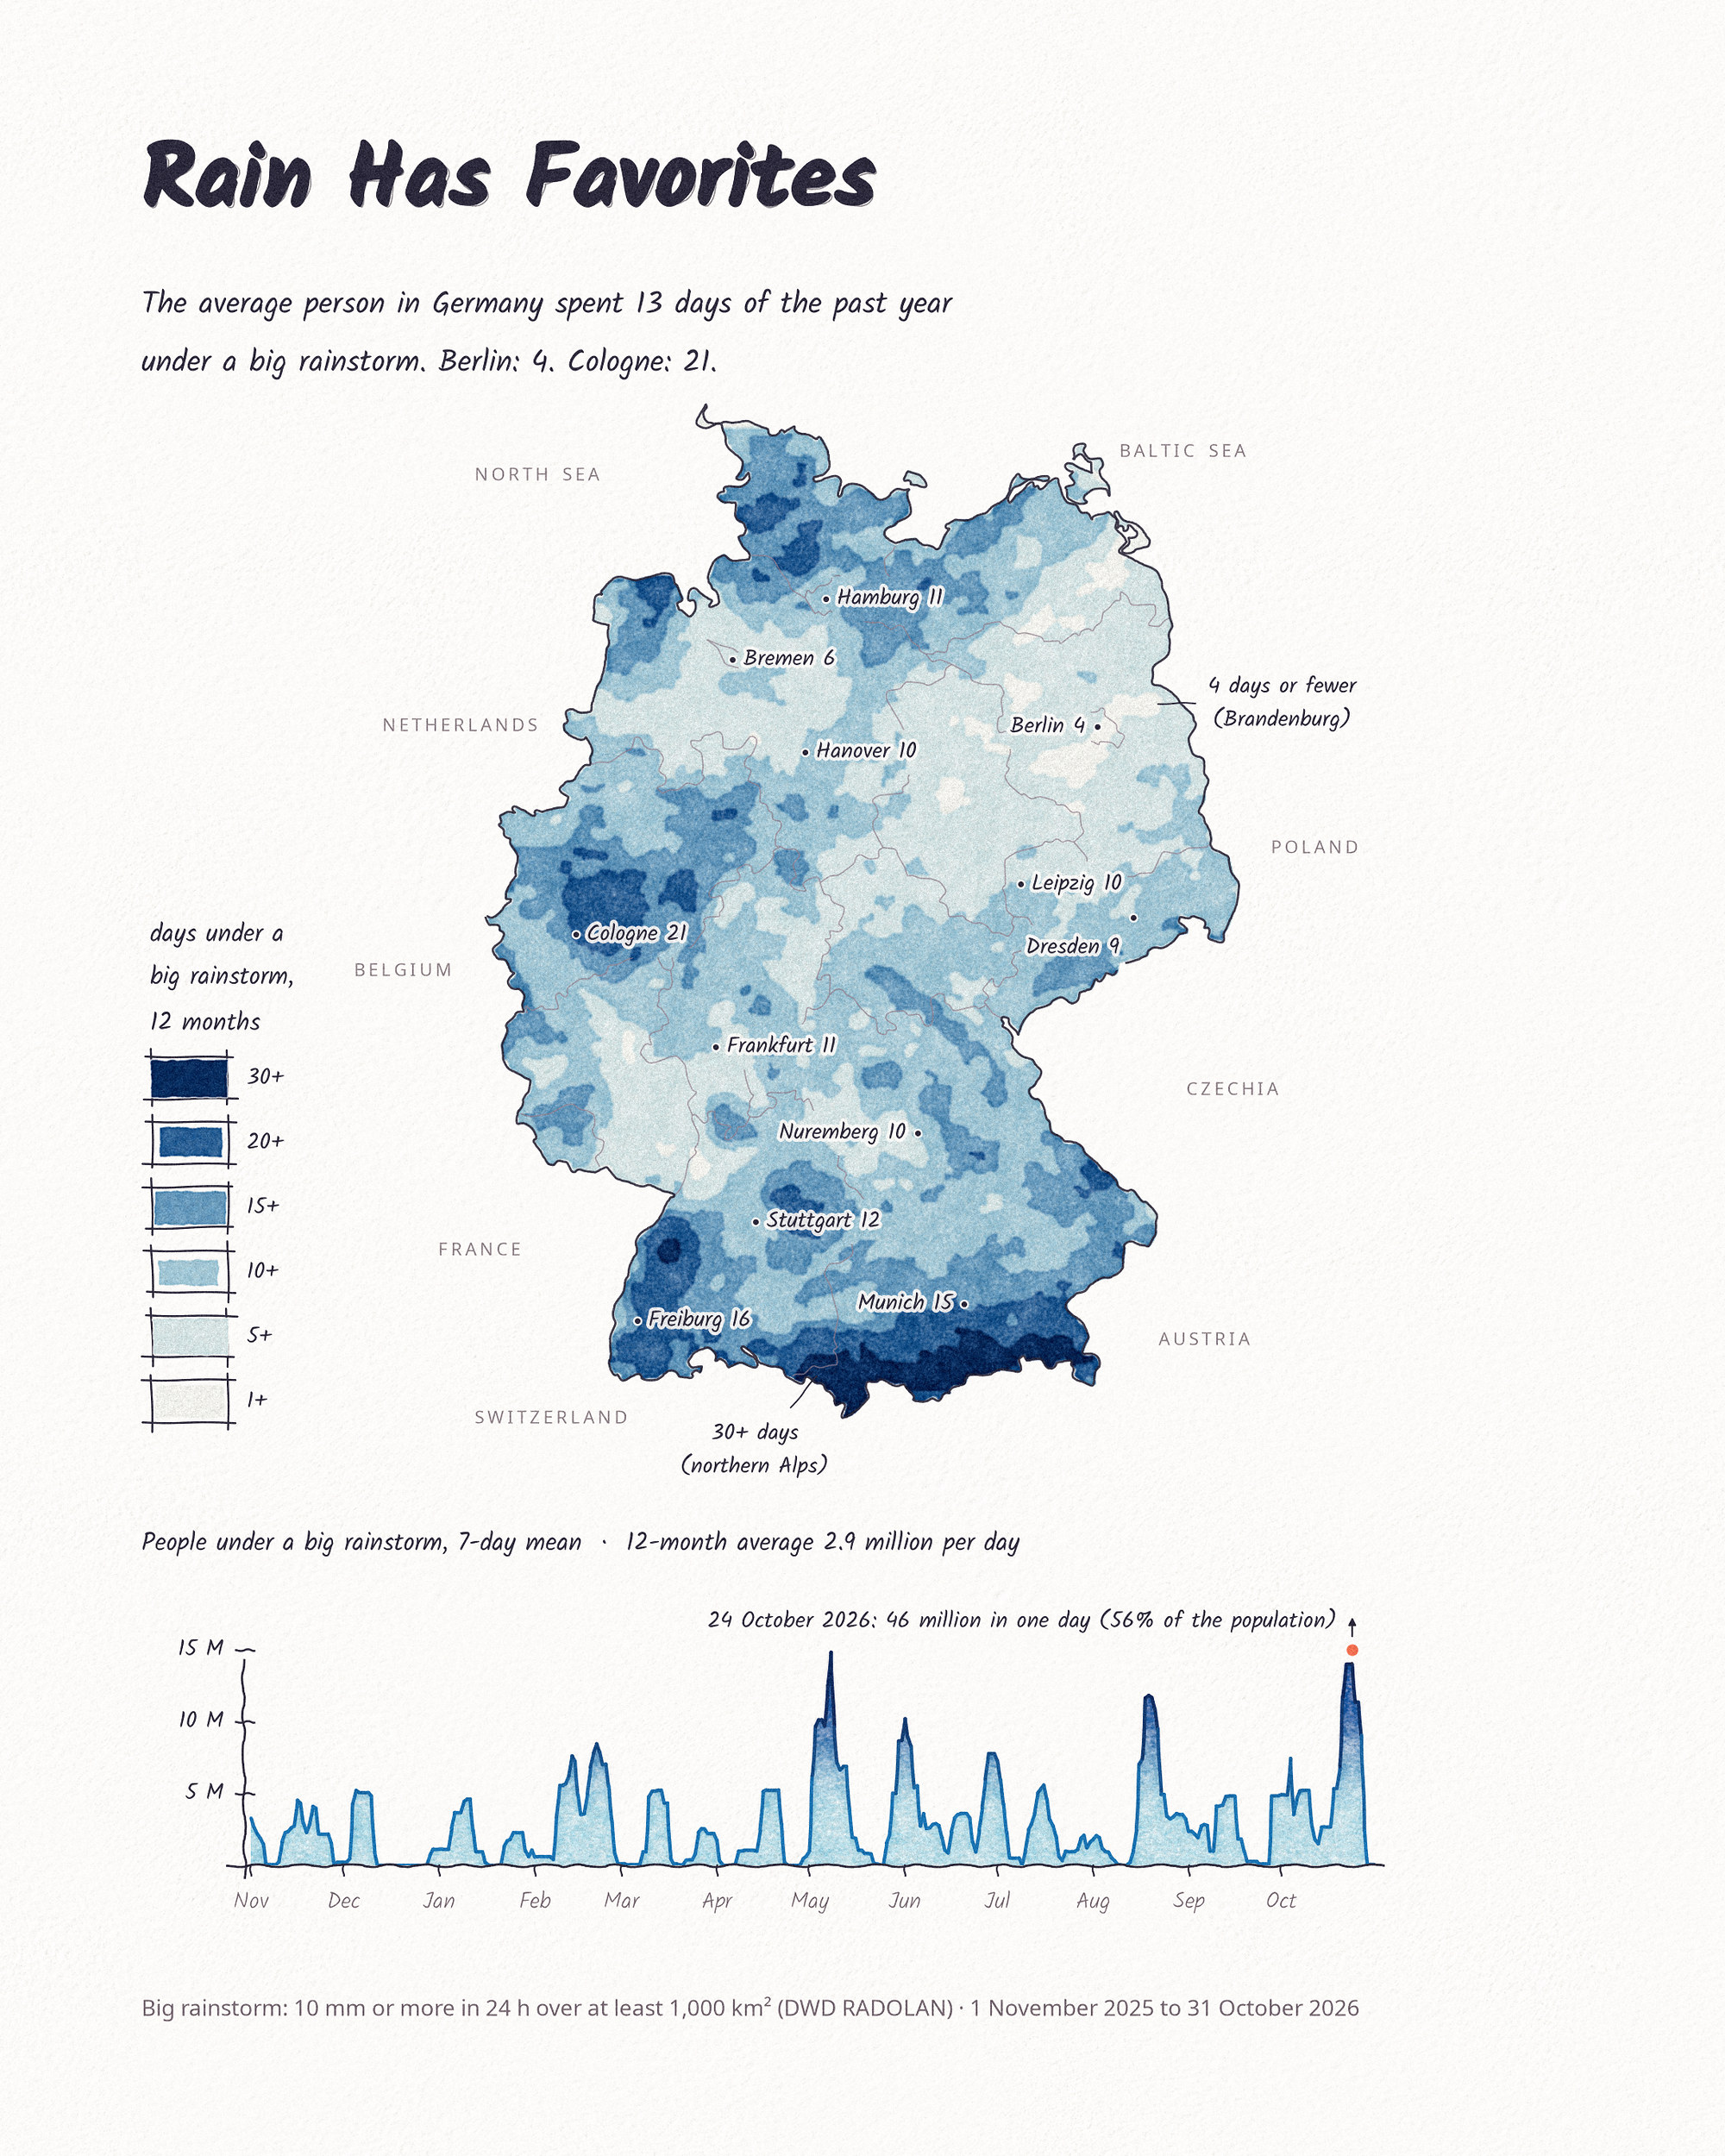
The same method on DWD’s RADOLAN radar. Germany is much smaller, so a big rainstorm there needs only 1,000 km²; that size matched DWD’s station-based HYRAS grid best. The average person in Germany spent 13 days under one. The northern edge of the Alps had 30 or more, Brandenburg around Berlin 4 or fewer. The minimum areas differ, so the two maps can’t be compared number for number.
Data and method
NOAA MRMS MultiSensor QPE 24-hour totals (Pass 2), aggregated to 2 km. Each day was smoothed, thresholded at 10 mm, gaps closed by 25 km, and areas under 10,000 km² dropped. People are counted from 2020 Census tract centers of population; the average is the population-weighted mean (30.6 days; the median is 34). City counts were checked against PRISM. Germany: DWD RADOLAN SF, 1,000 km² minimum, Zensus 2022 1 km population grid, checked against HYRAS.
Sources
- NOAA National Severe Storms Laboratory, Multi-Radar/Multi-Sensor System (MRMS), MultiSensor QPE 24 h Pass 2, via NOAA Open Data Dissemination on AWS.
- US Census Bureau, 2020 Census tract centers of population.
- US Census Bureau, cartographic boundary files (states), 2025.
- PRISM Climate Group, Oregon State University, daily precipitation (4 km), used for checking.
- Deutscher Wetterdienst (DWD), RADOLAN SF, daily gauge-adjusted radar precipitation, 1 km, DWD Open Data (CC BY 4.0).
- Deutscher Wetterdienst (DWD), HYRAS-DE-PR v6-1, daily gridded precipitation, 1 km, used for checking.
- Deutscher Wetterdienst (DWD), CatRaRE, Catalogue of Radar-based heavy Rainfall Events (prior work).
- Statistisches Bundesamt (Destatis), Zensus 2022, population on a 1 km grid.
- Bundesamt für Kartographie und Geodäsie (BKG), VG2500 administrative boundaries (dl-de/by-2-0).