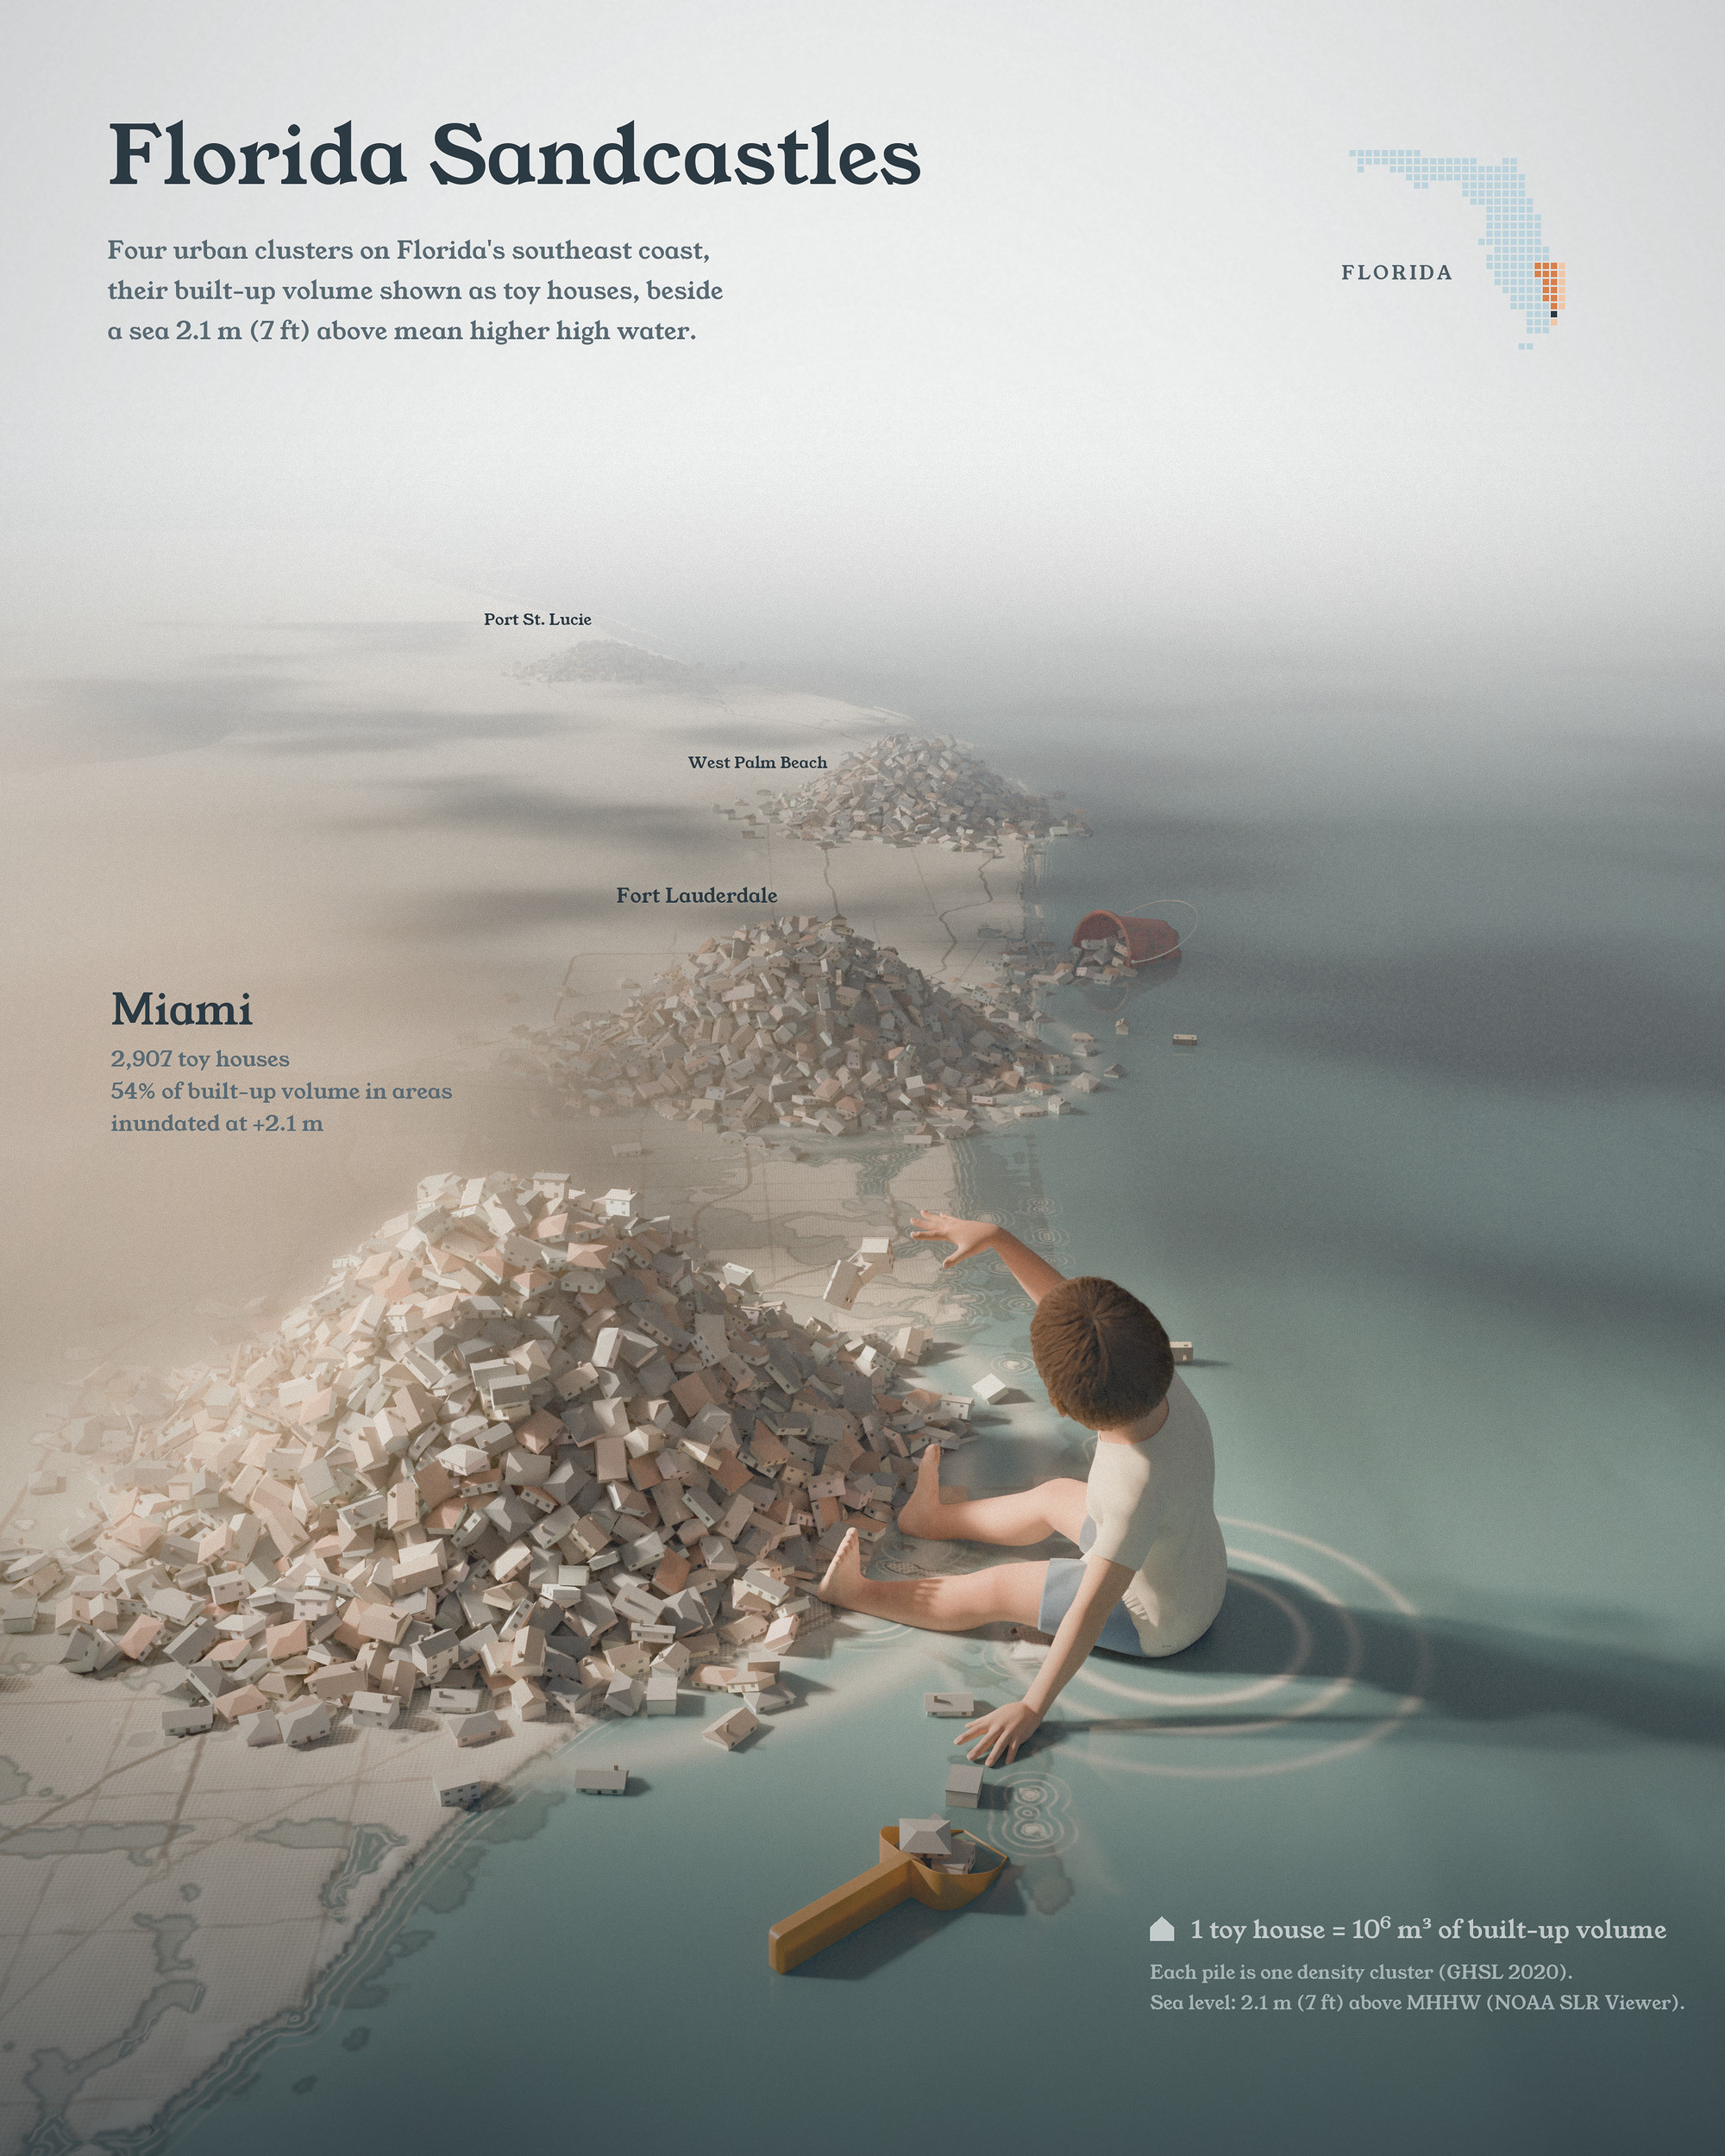
The Clusters theme made me think of sand: cities pile up at the water’s edge. Each toy house here is 1 million m³ of building volume, about one Empire State Building. The Miami area, from Homestead to Hollywood, is 2,907 of them, Fort Lauderdale 1,823, West Palm Beach 1,423 and Port St. Lucie 674.
Clusters of building volume
The building volume comes from the EU’s Global Human Settlement Layer (2020, 100 m cells). I smoothed it with a 5 km kernel and gave every cell to the density peak it climbs to, which is mean-shift clustering on a grid. A simple density threshold doesn’t work here: South Florida’s suburbs are so even that you get either one 140 km city or dust. Each cluster became one pile, dropped at its peak and settled by a physics engine.
Sea level 2.1 m above high tide
The water sits 2.1 m (7 ft) above mean higher high water, from NOAA’s Sea Level Rise Viewer. At that level, 54% of the Miami area’s building volume is in flooded areas, 35% of Fort Lauderdale’s and 7% of West Palm Beach’s. It is a scenario with no year attached, and only ocean-connected flooding counts, so the shares are on the low side.
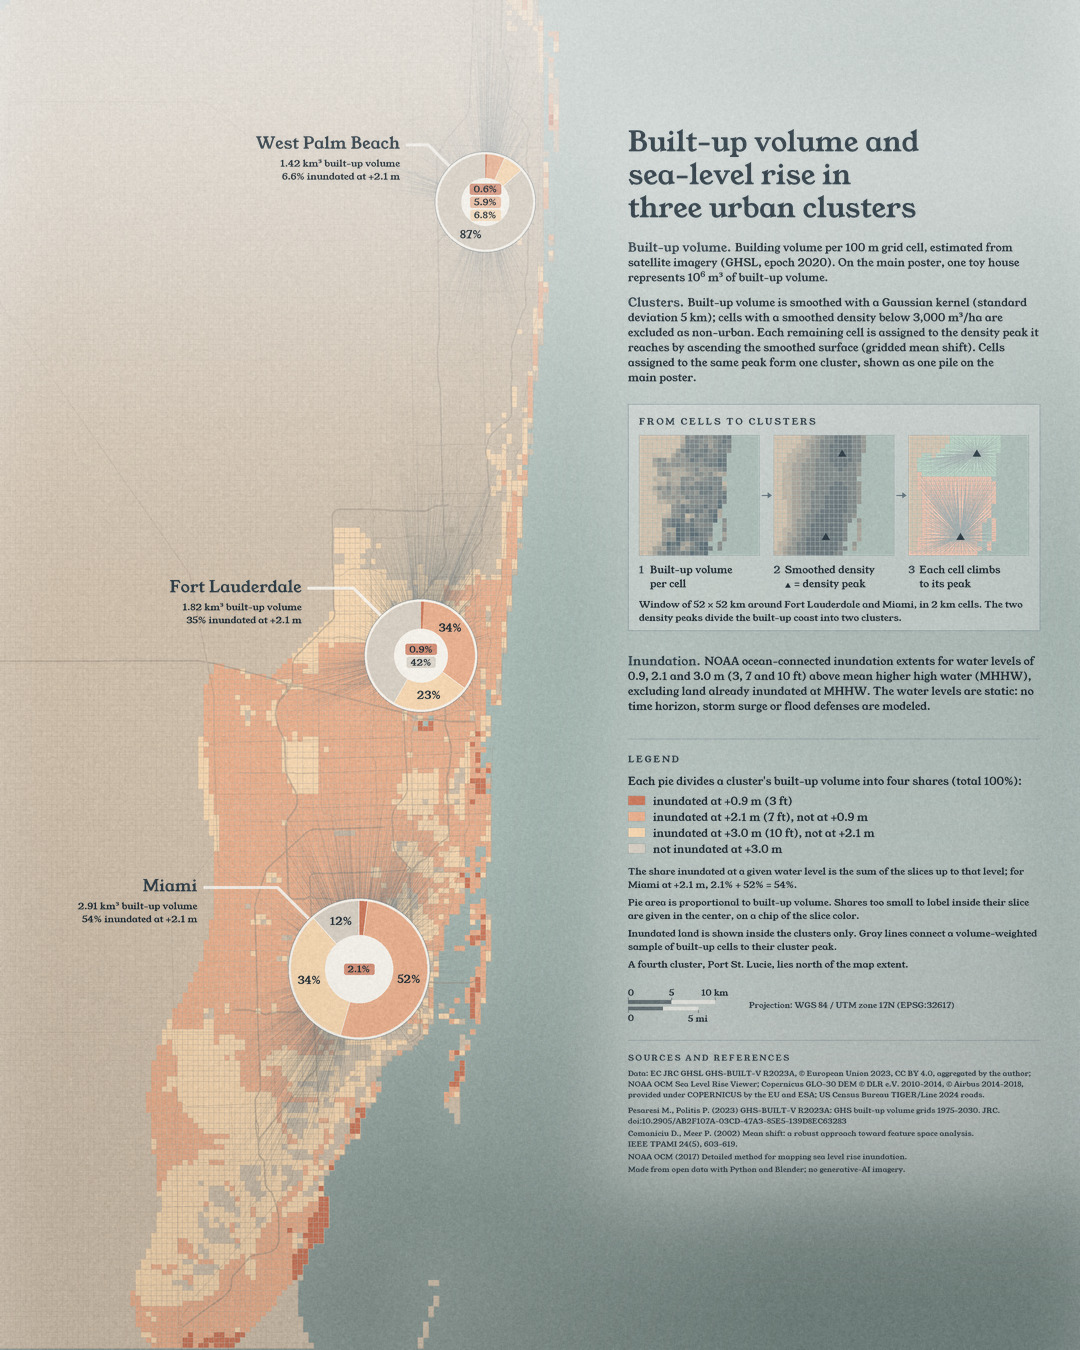
At 0.9 m the Miami share is 2%, at 3.0 m it is 88%. Along the whole coast at 2.1 m, 2.35 of 6.83 billion m³ of buildings would be in flooded areas, about a third.
Data and method
GHS-BUILT-V R2023A, epoch 2020; Gaussian kernel with a standard deviation of 5 km; gridded mean shift. NOAA ocean-connected inundation extents at 3, 7 and 10 ft above MHHW, without storm surge, groundwater or flood defenses. No generative AI imagery.
References
- Pesaresi, M. and Politis, P. (2023). GHS-BUILT-V R2023A: GHS built-up volume grids derived from joint assessment of Sentinel-2, Landsat, and global DEM data, multitemporal (1975-2030). European Commission, Joint Research Centre, doi:10.2905/AB2F107A-03CD-47A3-85E5-139D8EC63283 (CC BY 4.0).
- NOAA Office for Coastal Management. Sea Level Rise Viewer: ocean-connected inundation extents, 3, 7 and 10 ft above MHHW.
- NOAA Office for Coastal Management (2017). Detailed method for mapping sea level rise inundation.
- NOAA National Centers for Environmental Information (2022). ETOPO 2022 15 Arc-Second Global Relief Model, doi:10.25921/fd45-gt74.
- Copernicus DEM GLO-30: © DLR e.V. 2010-2014 and © Airbus Defence and Space GmbH 2014-2018, provided under COPERNICUS by the European Union and ESA.
- US Census Bureau. TIGER/Line Shapefiles 2024 (roads).
- Fukunaga, K. and Hostetler, L. (1975). The estimation of the gradient of a density function, with applications in pattern recognition. IEEE Trans. Inf. Theory 21, 32-40.
- Comaniciu, D. and Meer, P. (2002). Mean shift: a robust approach toward feature space analysis. IEEE Trans. Pattern Anal. Mach. Intell. 24, 603-619.