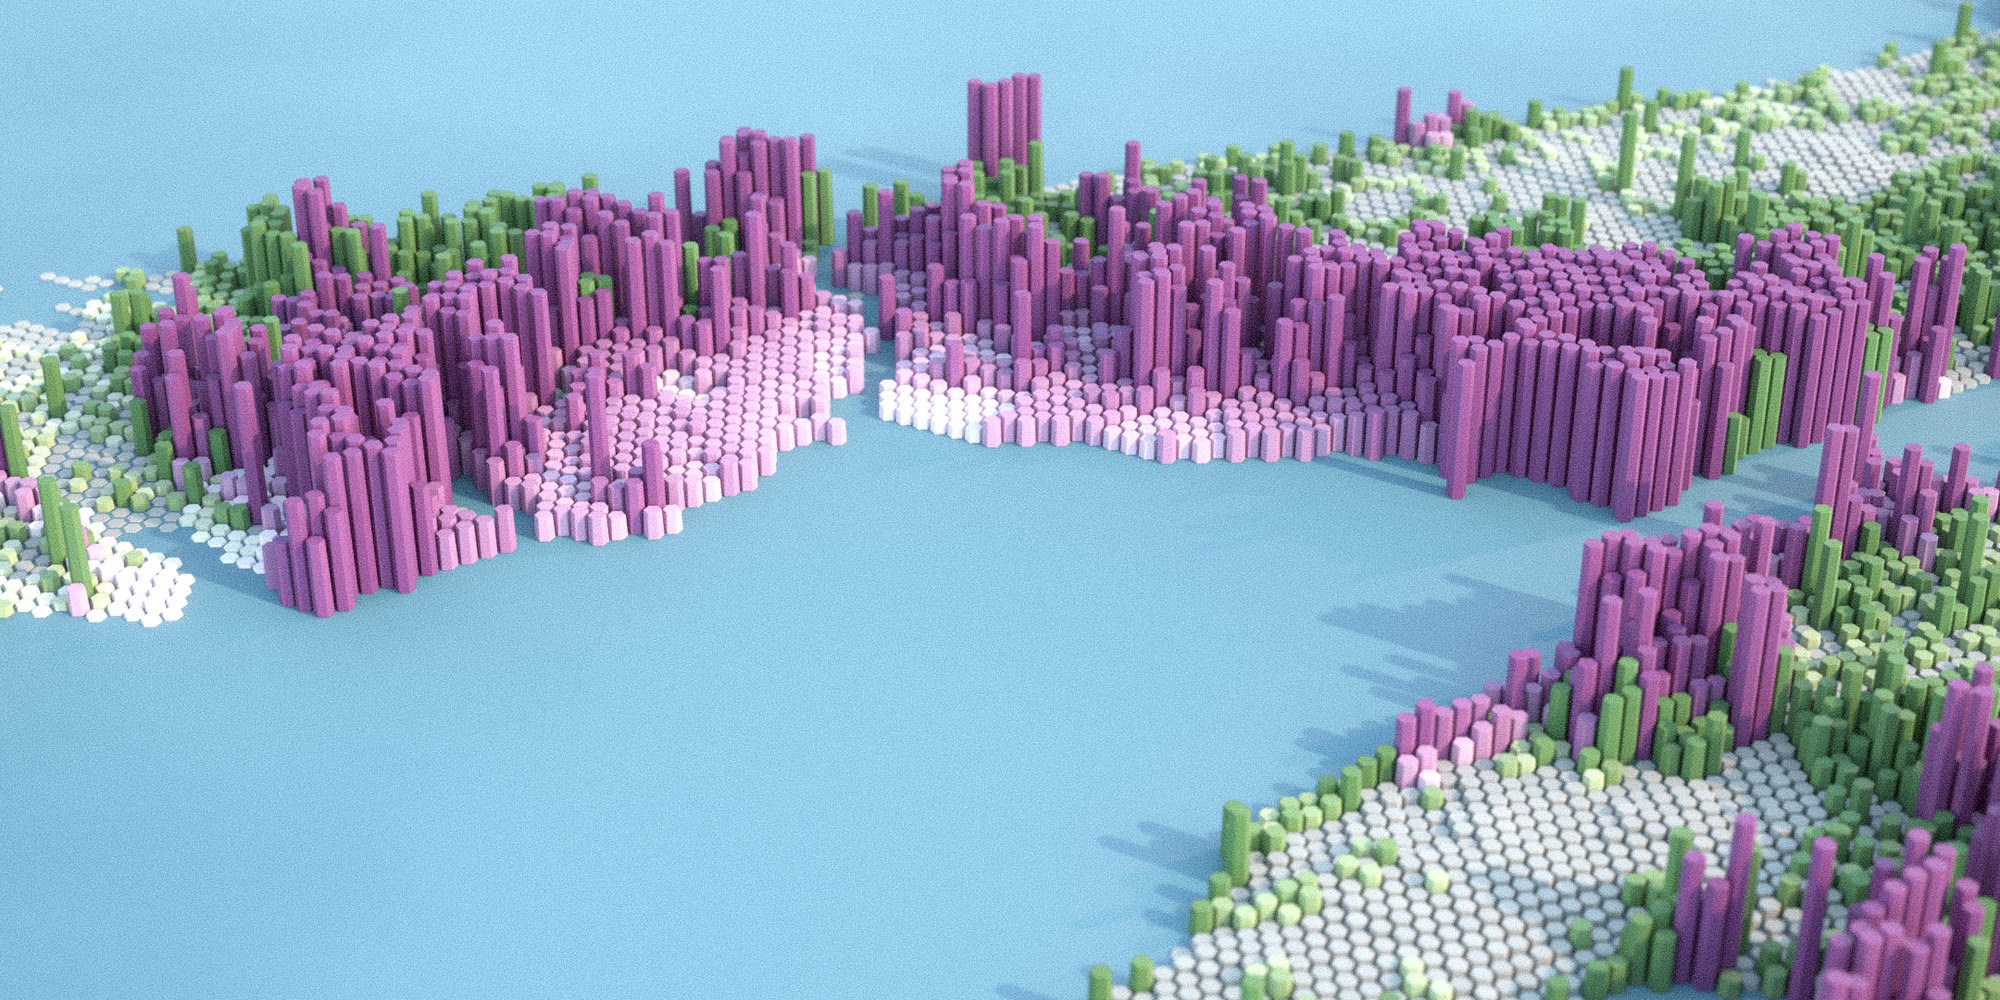
Fifty years. In 1975 about 40 million people lived in Türkiye, now it's around 85 million. Most of the new people ended up in cities, that part everyone knows. I wanted to see where, exactly. Hexagon by hexagon.
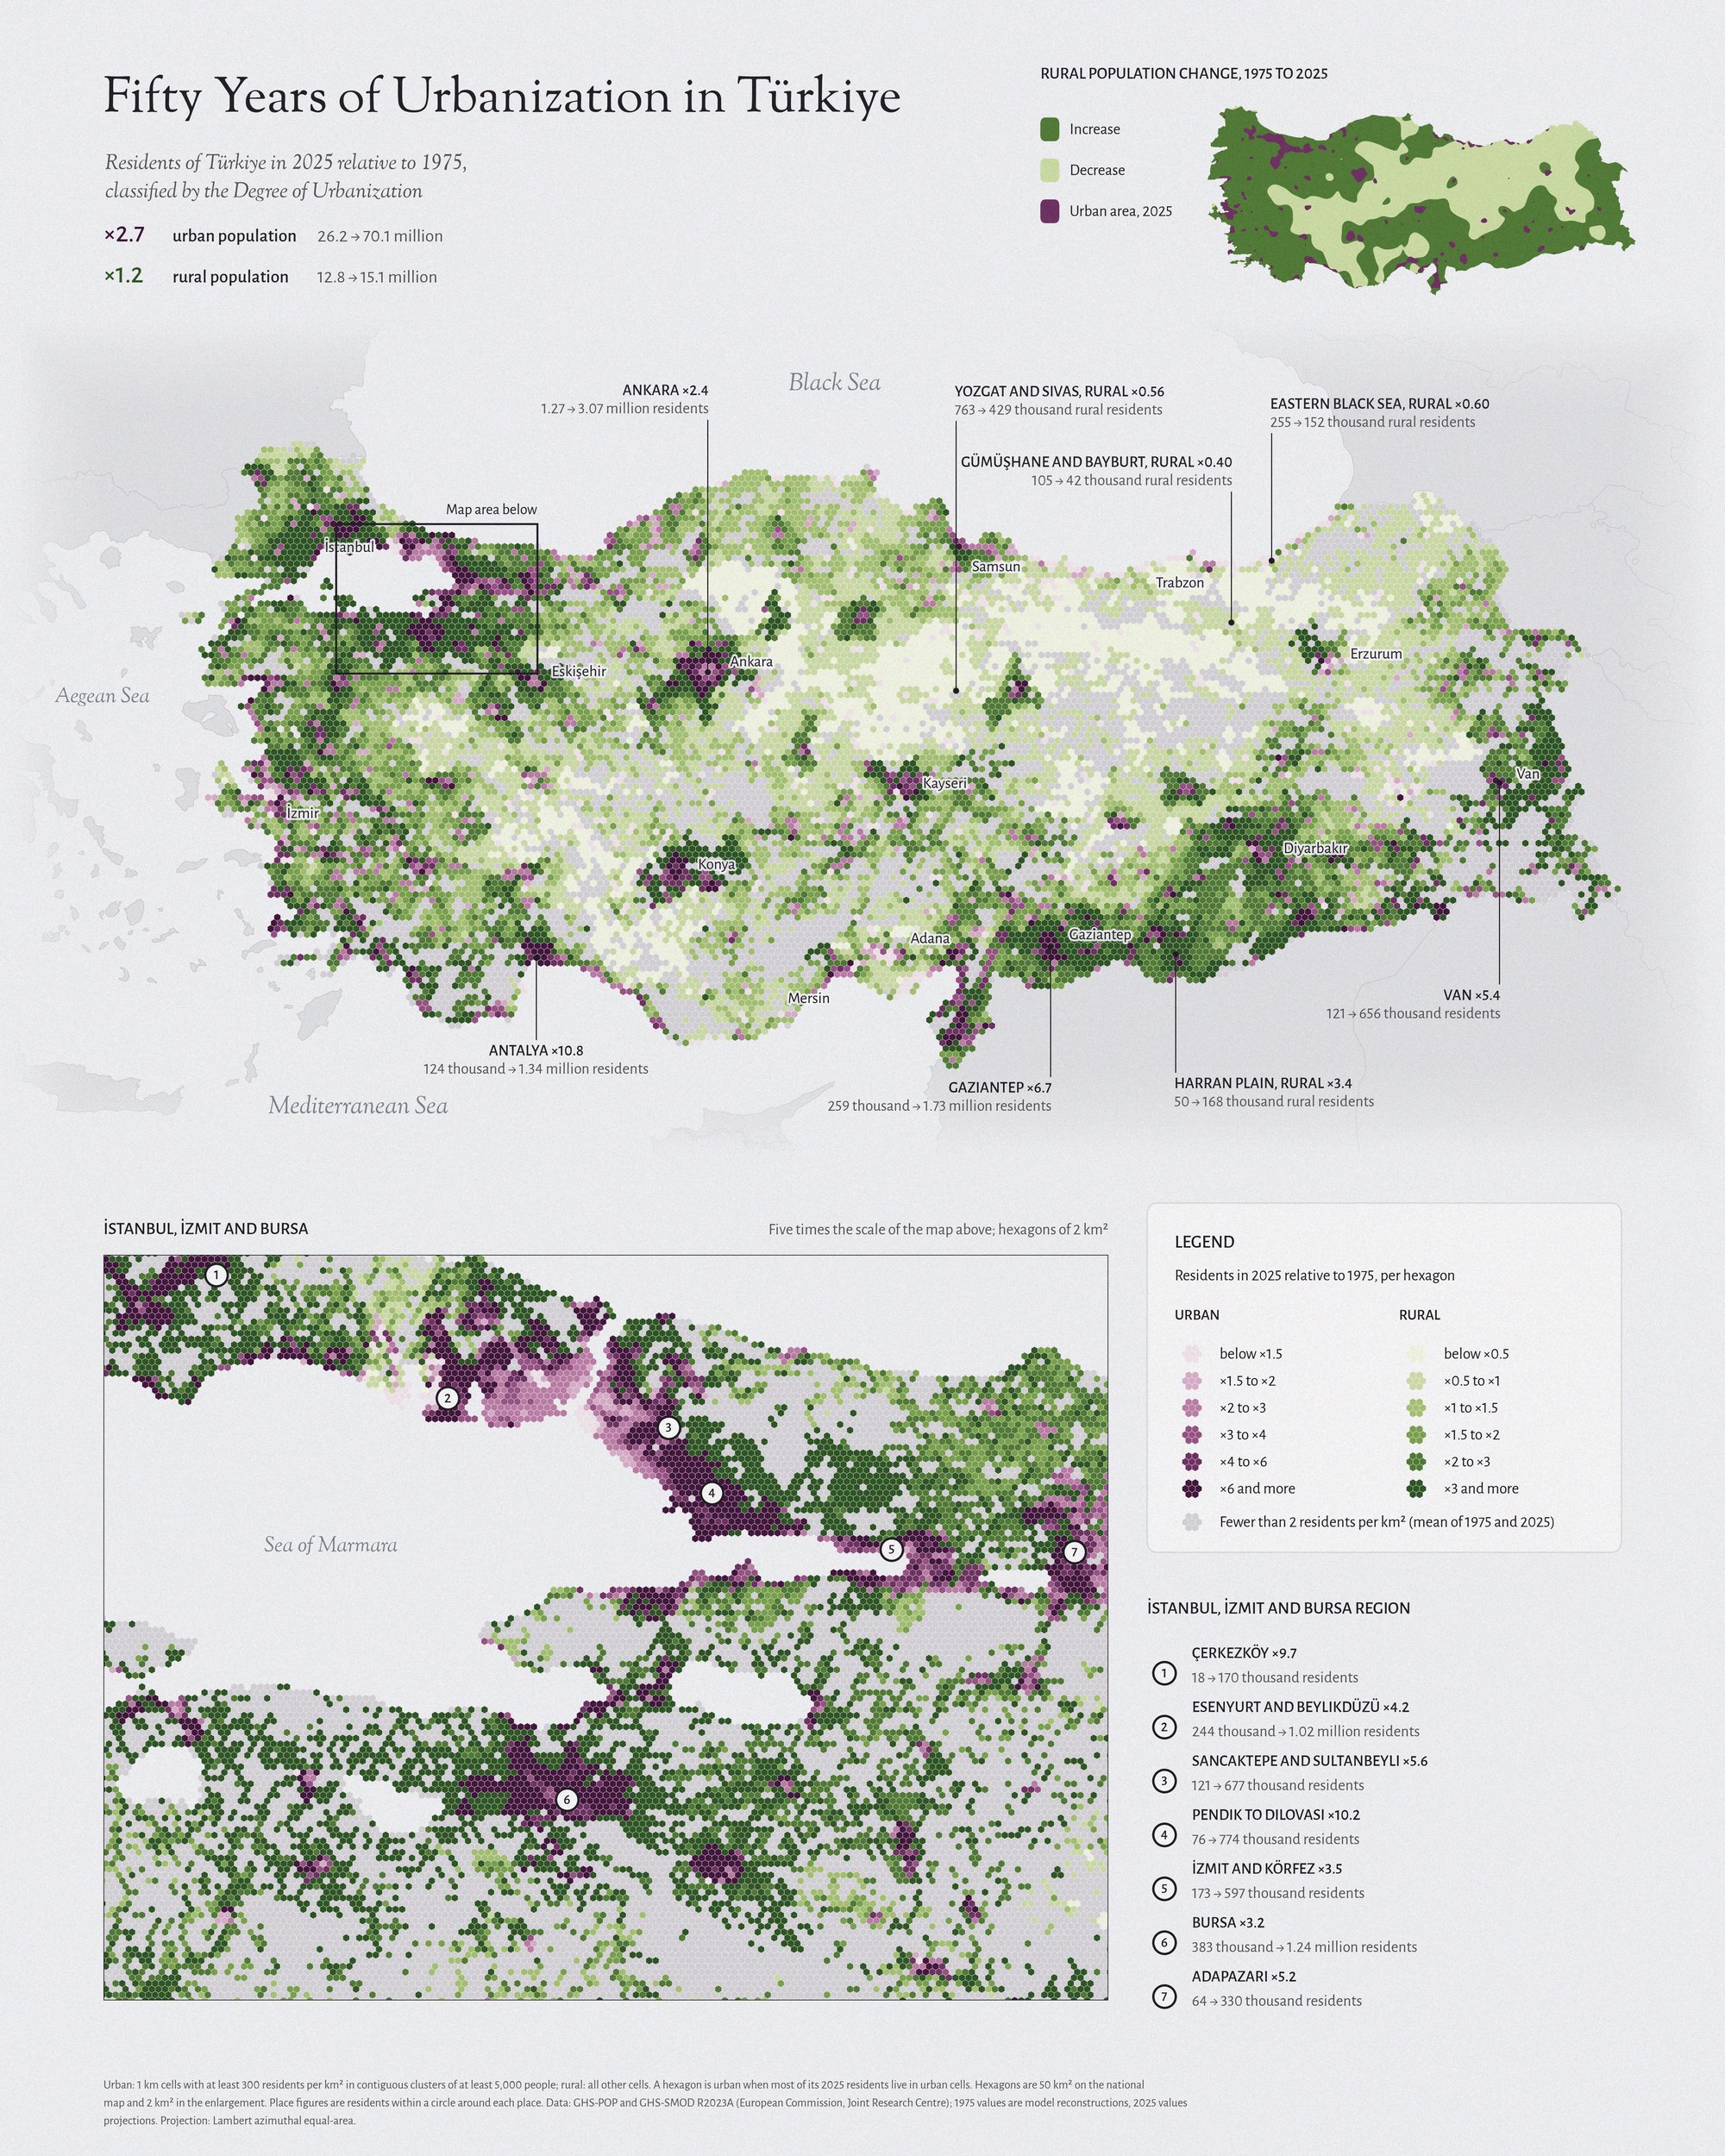
Plum is urban, green is rural. The darker it gets, the more people live there now compared to 1975. The number of people living in urban areas went up 2.7 times, from 26.2 to 70.1 million. The rural population grew too, a little, 1.2 times, from 12.8 to 15.1 million. Urban land itself roughly doubled.
The rural side is what got me. I expected the countryside to just empty out. It didn't, not everywhere. In the plains of the west, the south and the east the rural population grew; on the Harran plain more than three times. In central Anatolia and along the Black Sea it fell. Gümüşhane and Bayburt lost much of their rural population.
Five places in 3D
Then I couldn't stop and built the same data in 3D. Five places, 1 km² per column. Careful though: the height is how much the population of a place changed, not how many people live there. A tall column means fast growth. There's a hidden terrain under it all, just enough to feel the valleys, it carries no data.
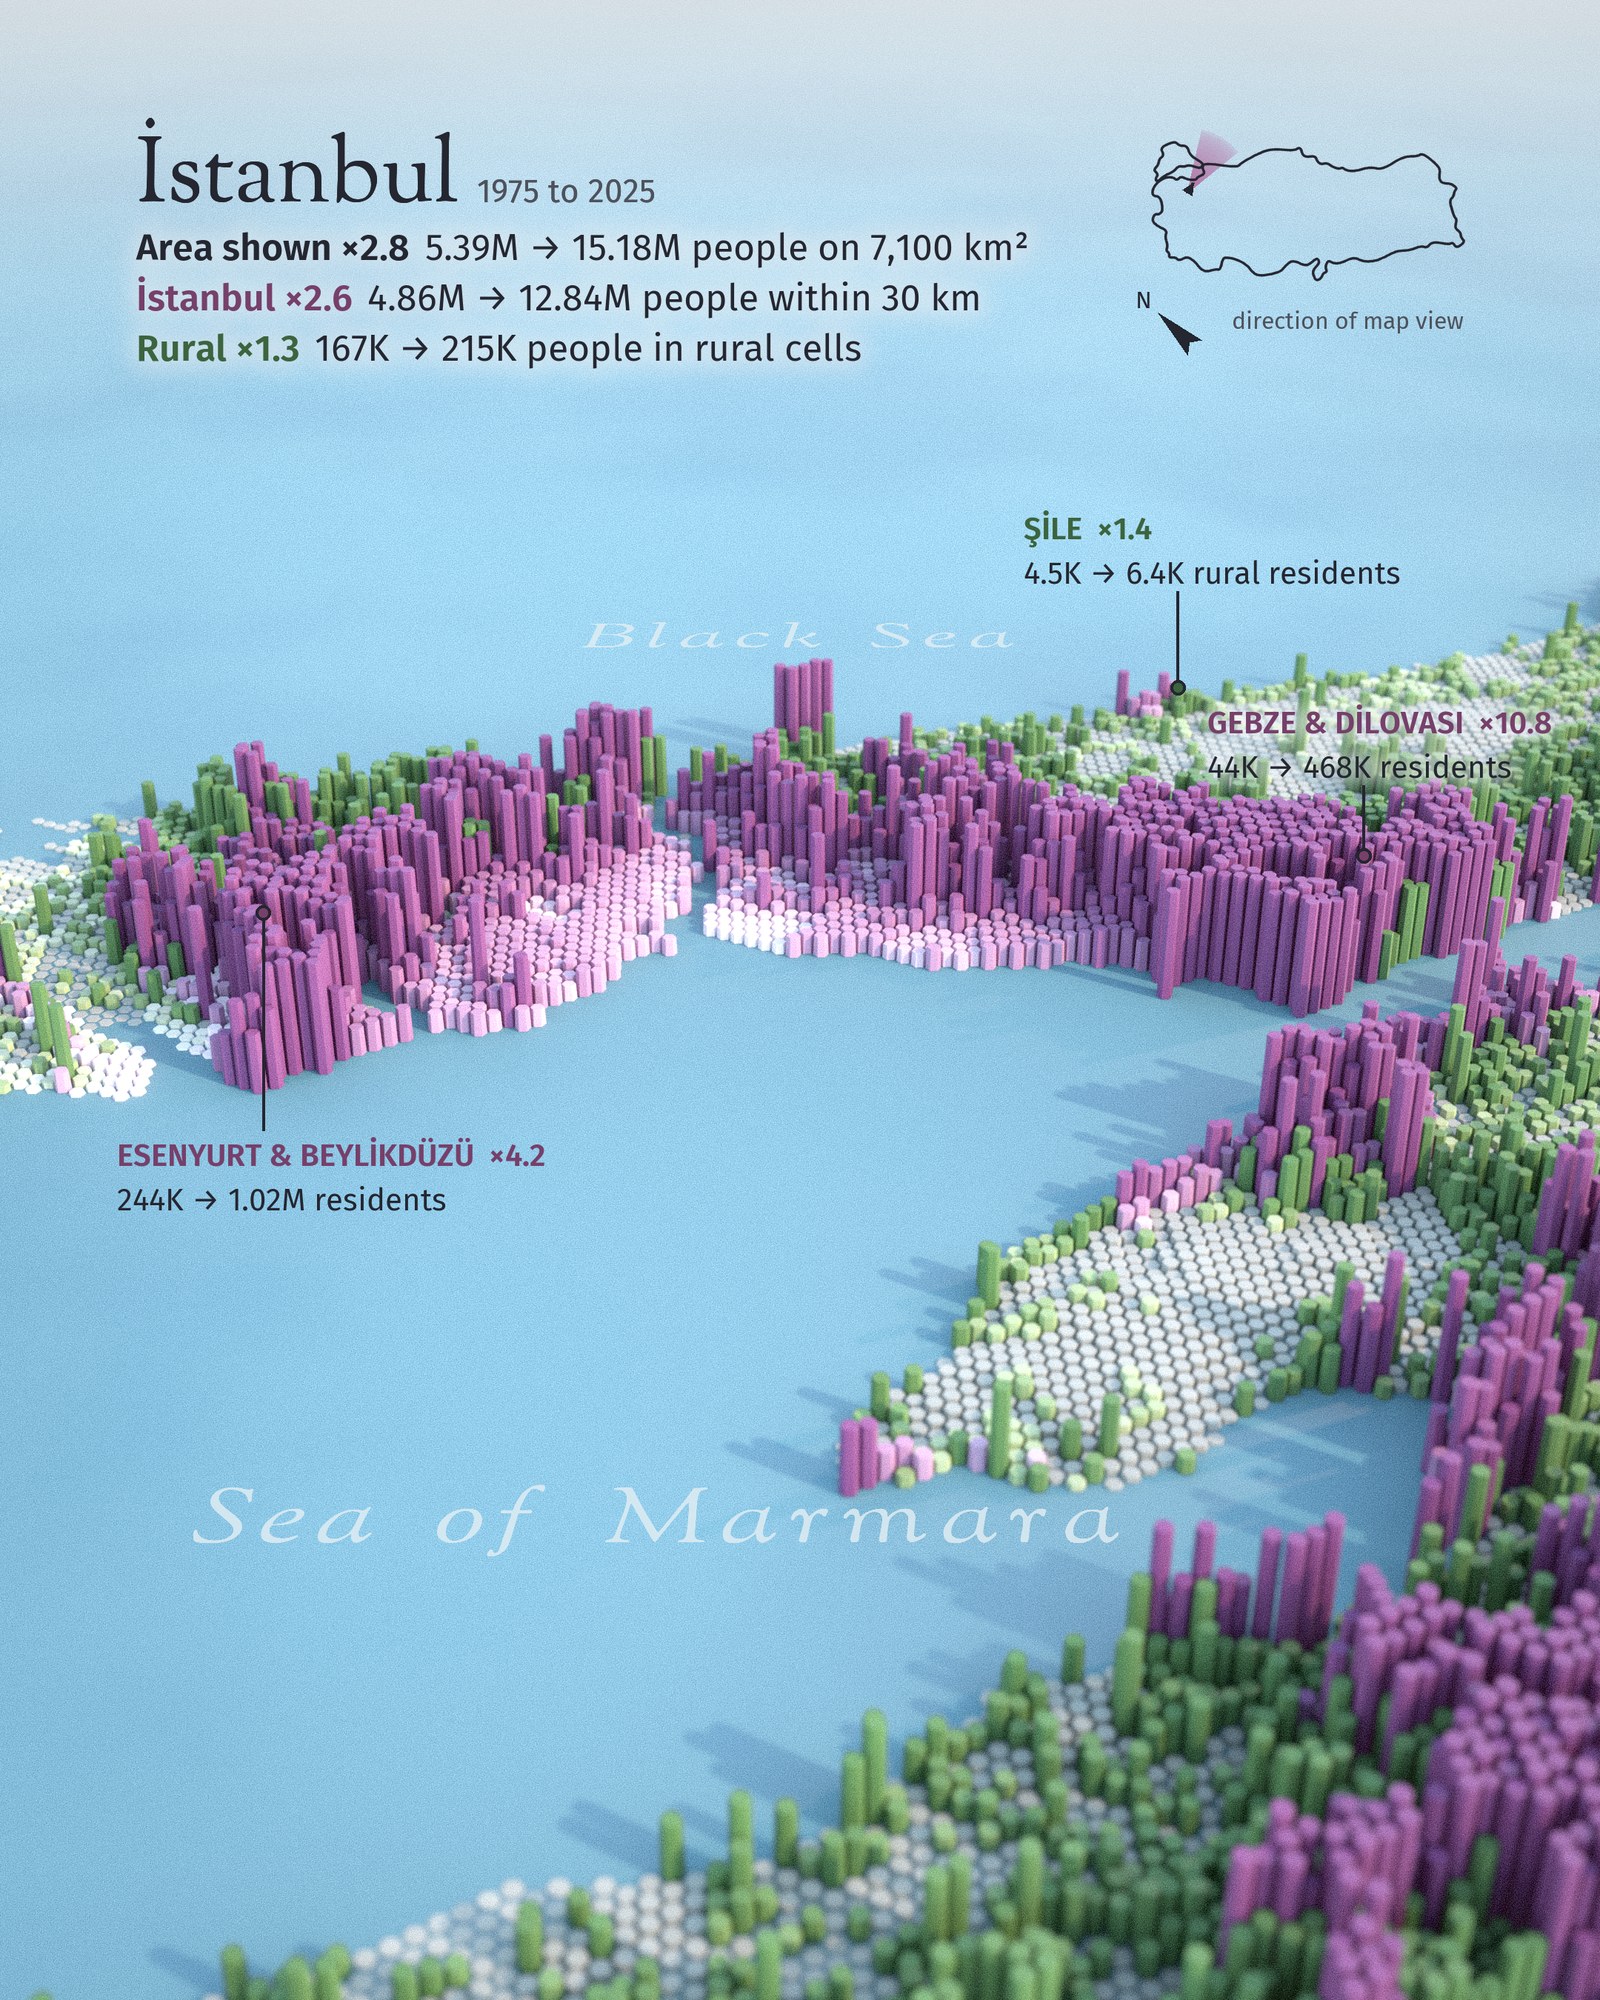
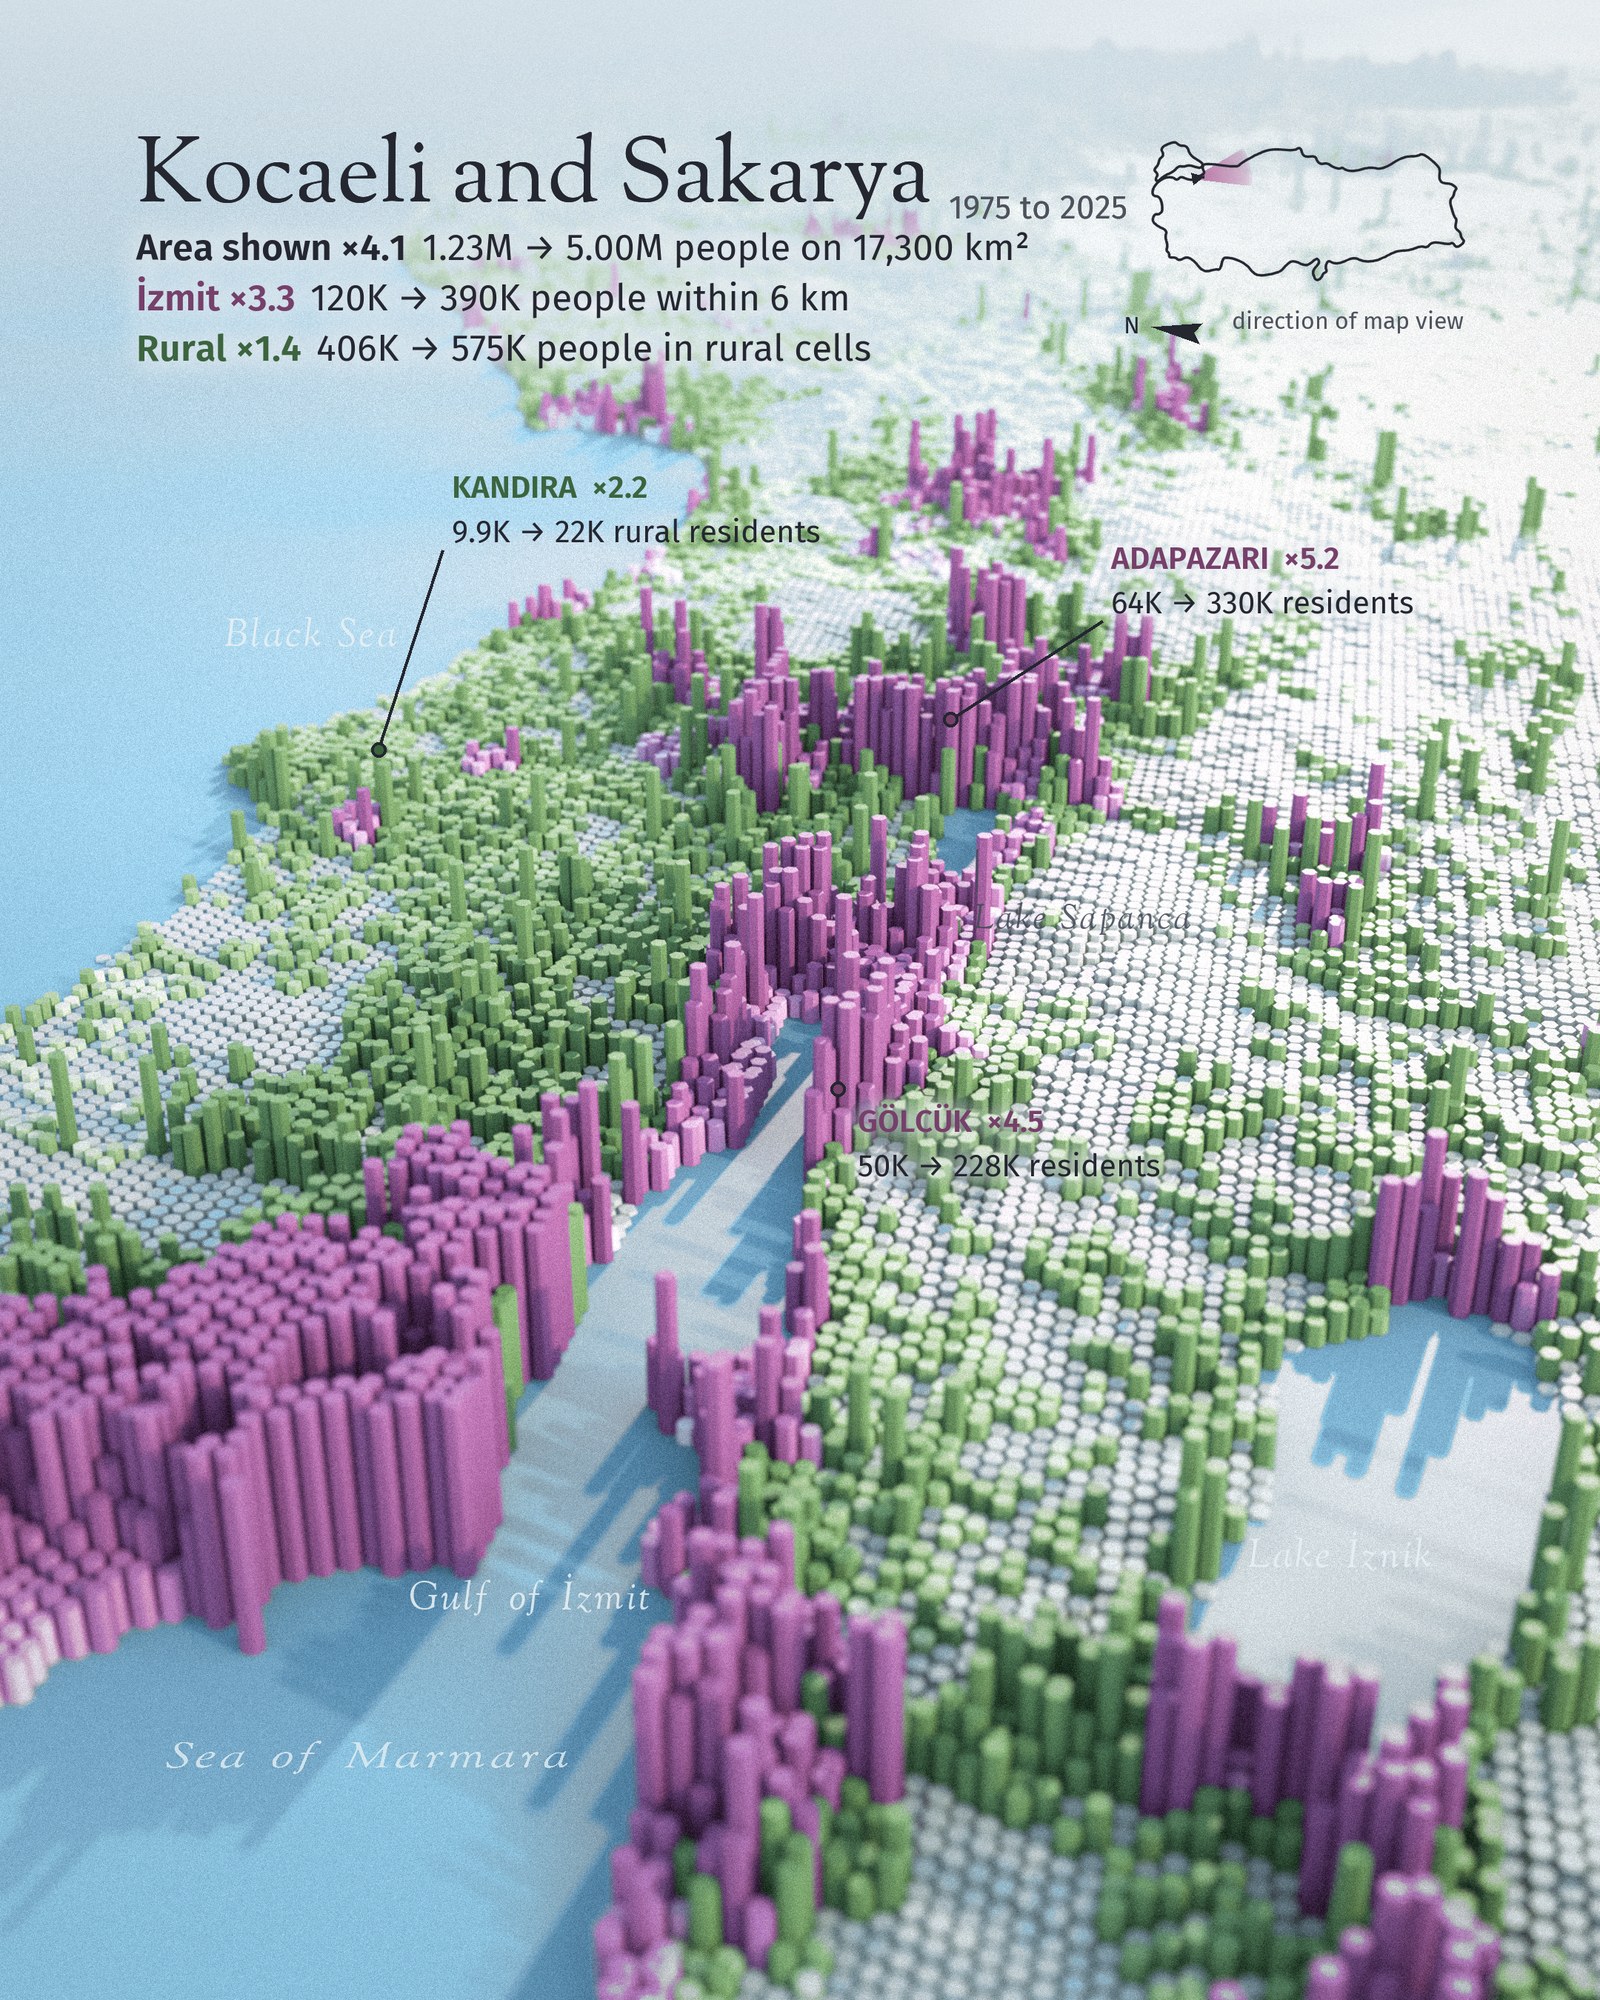
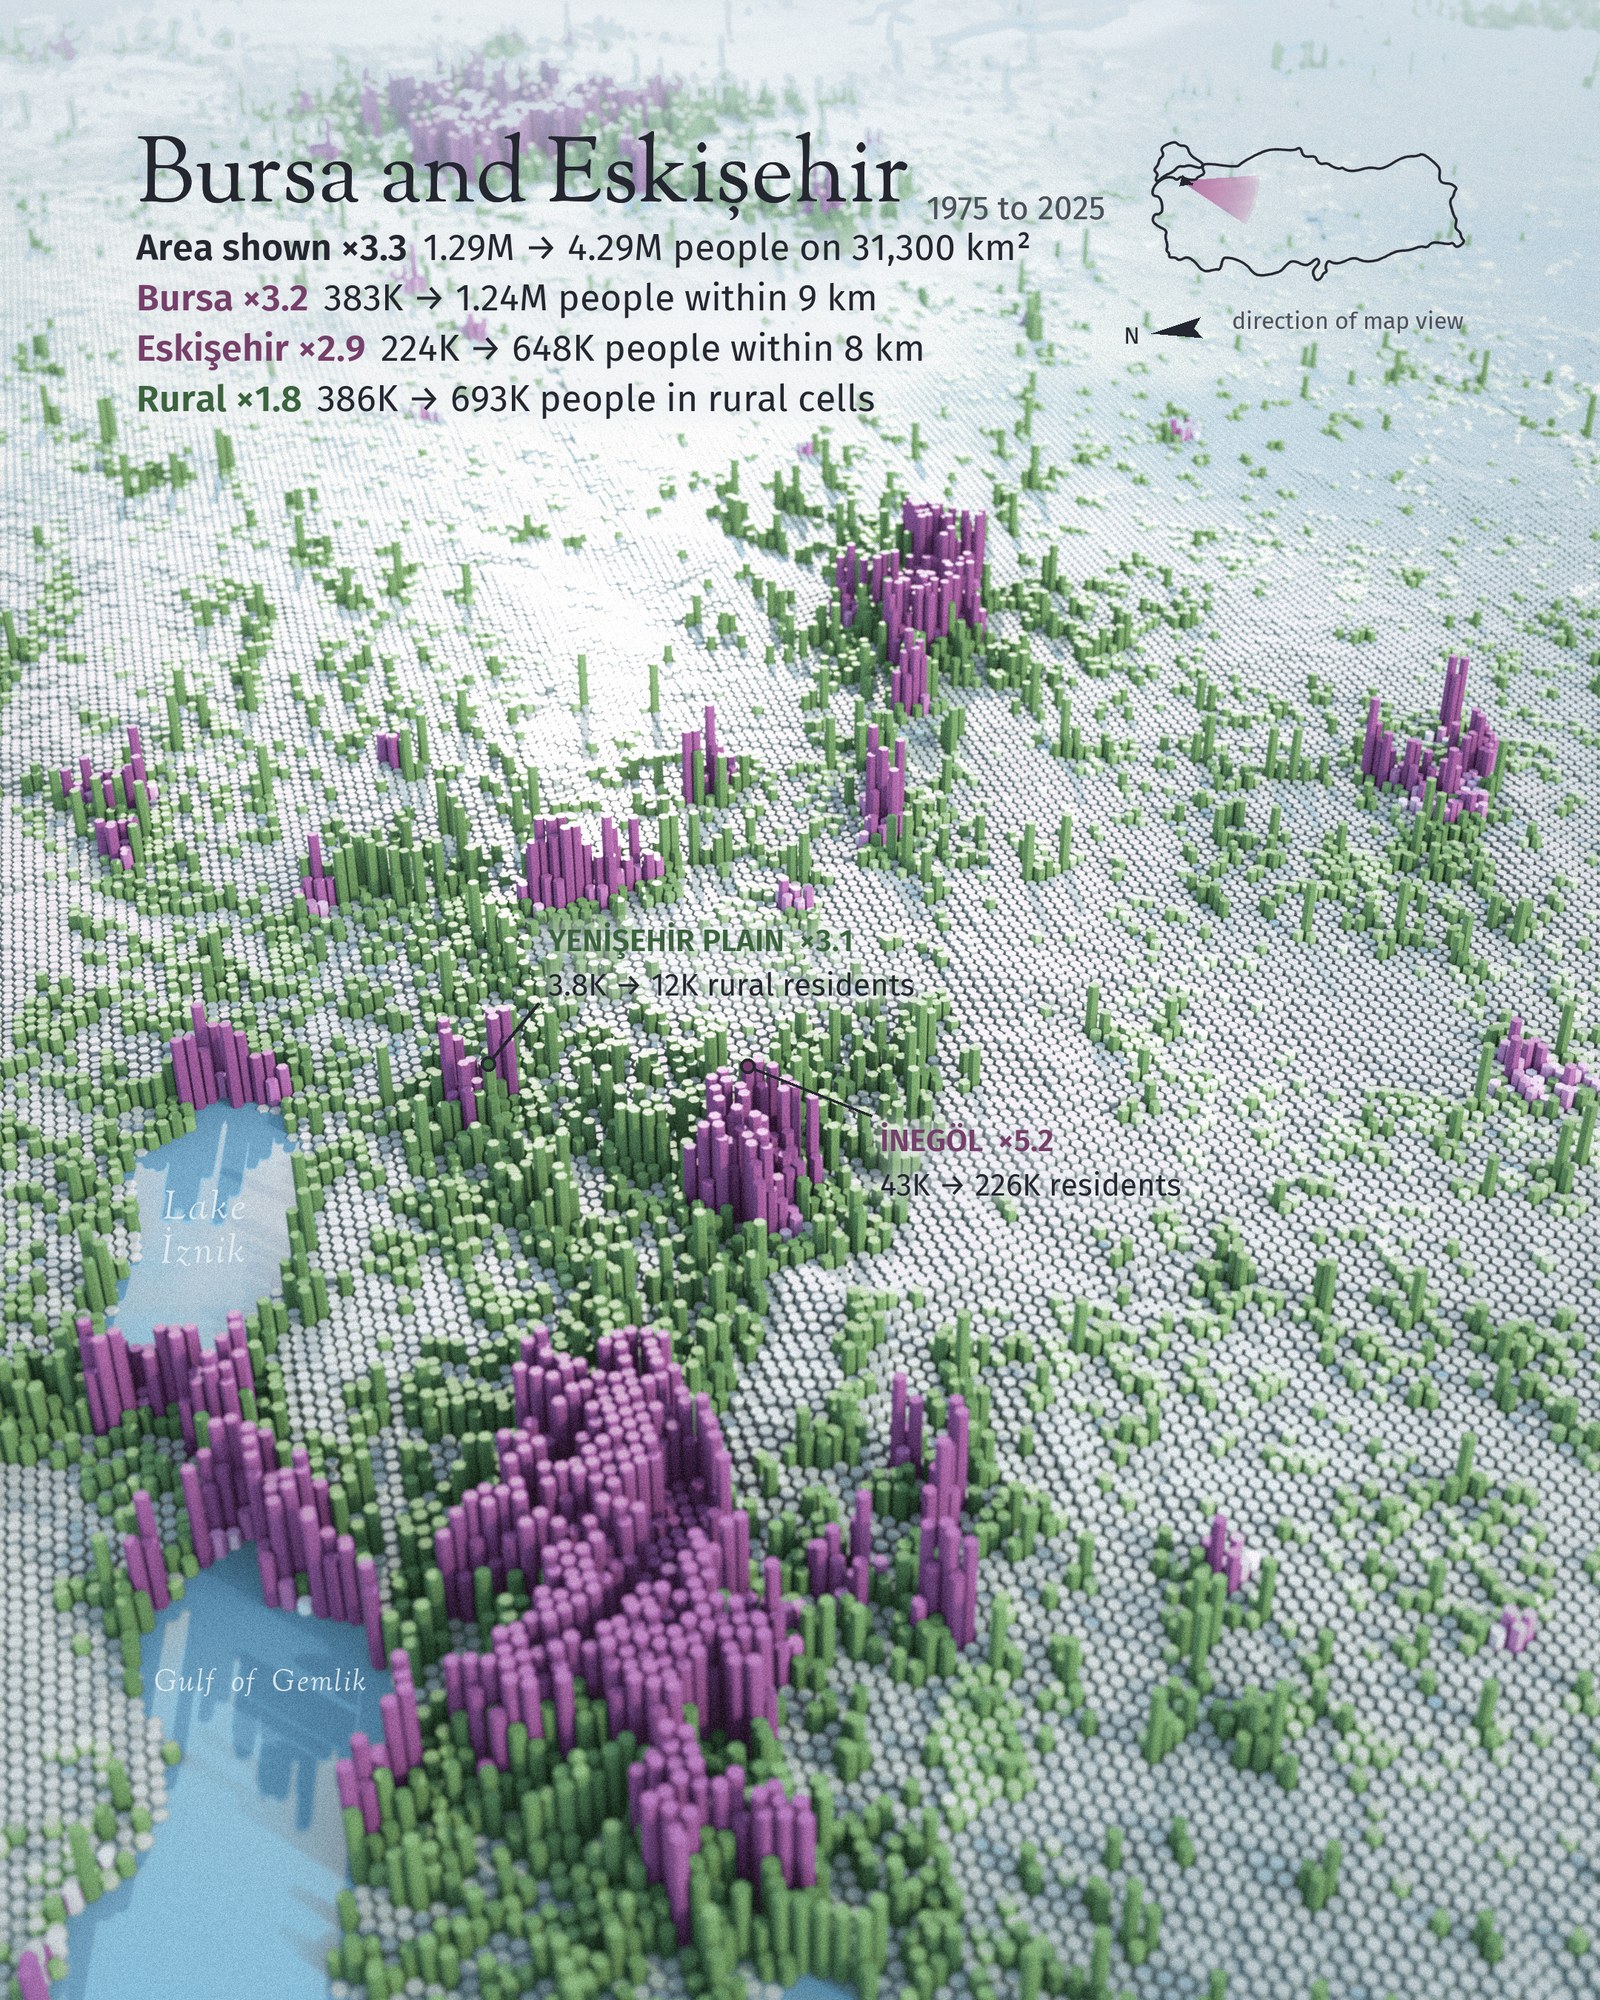
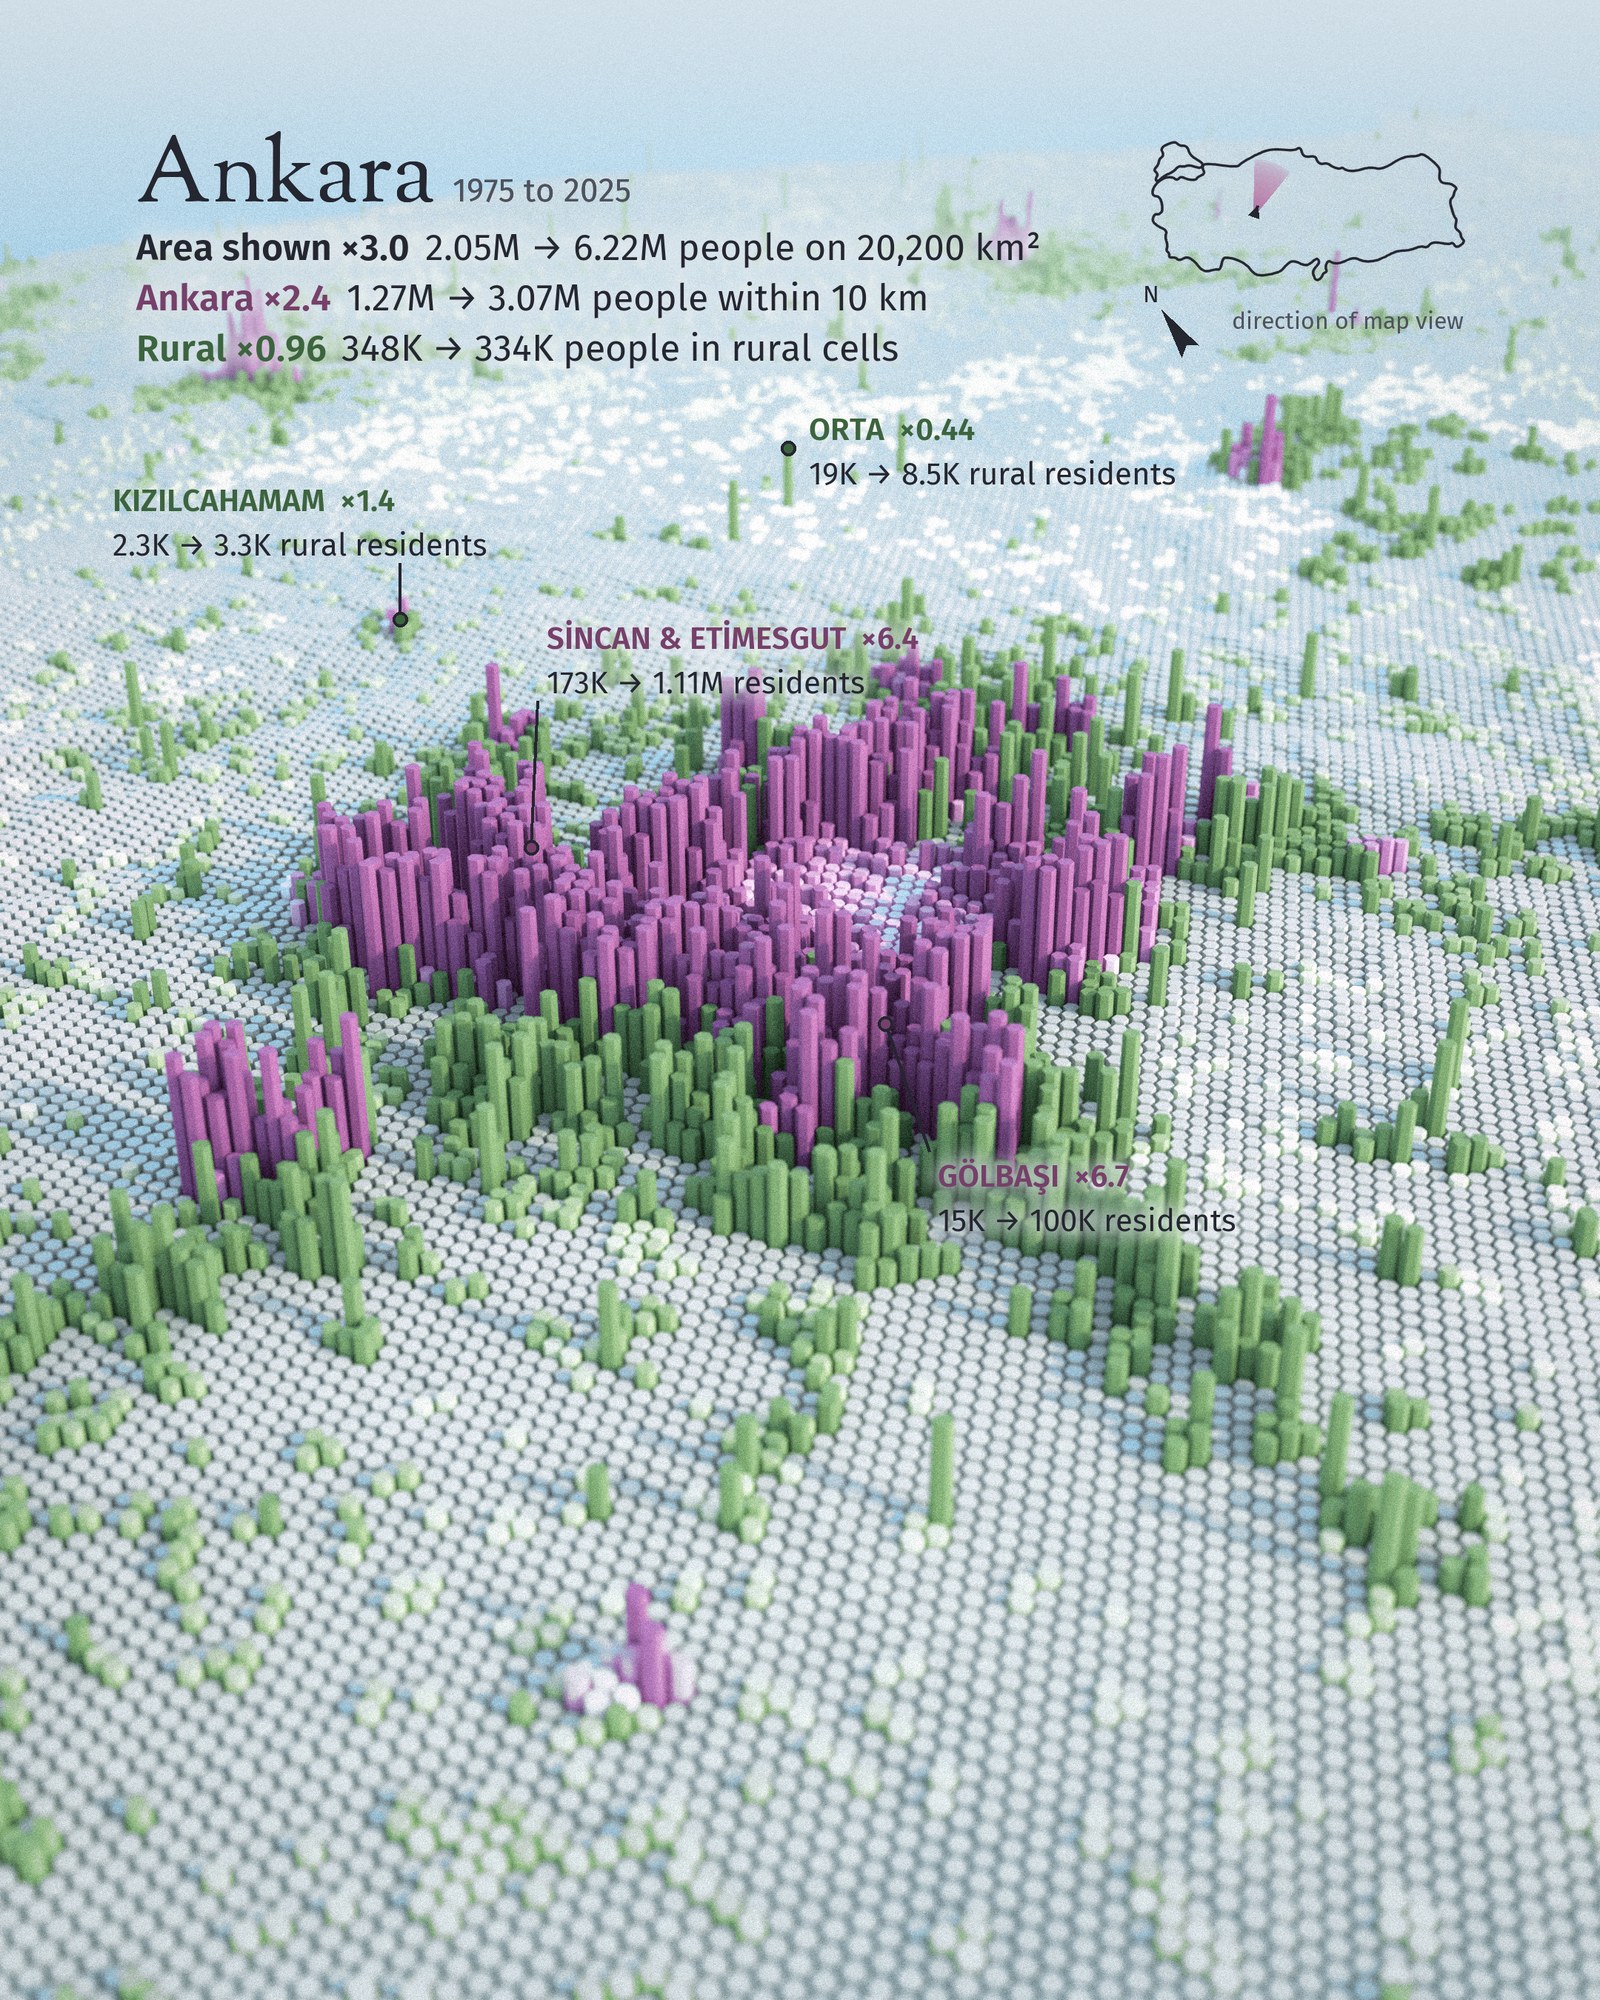
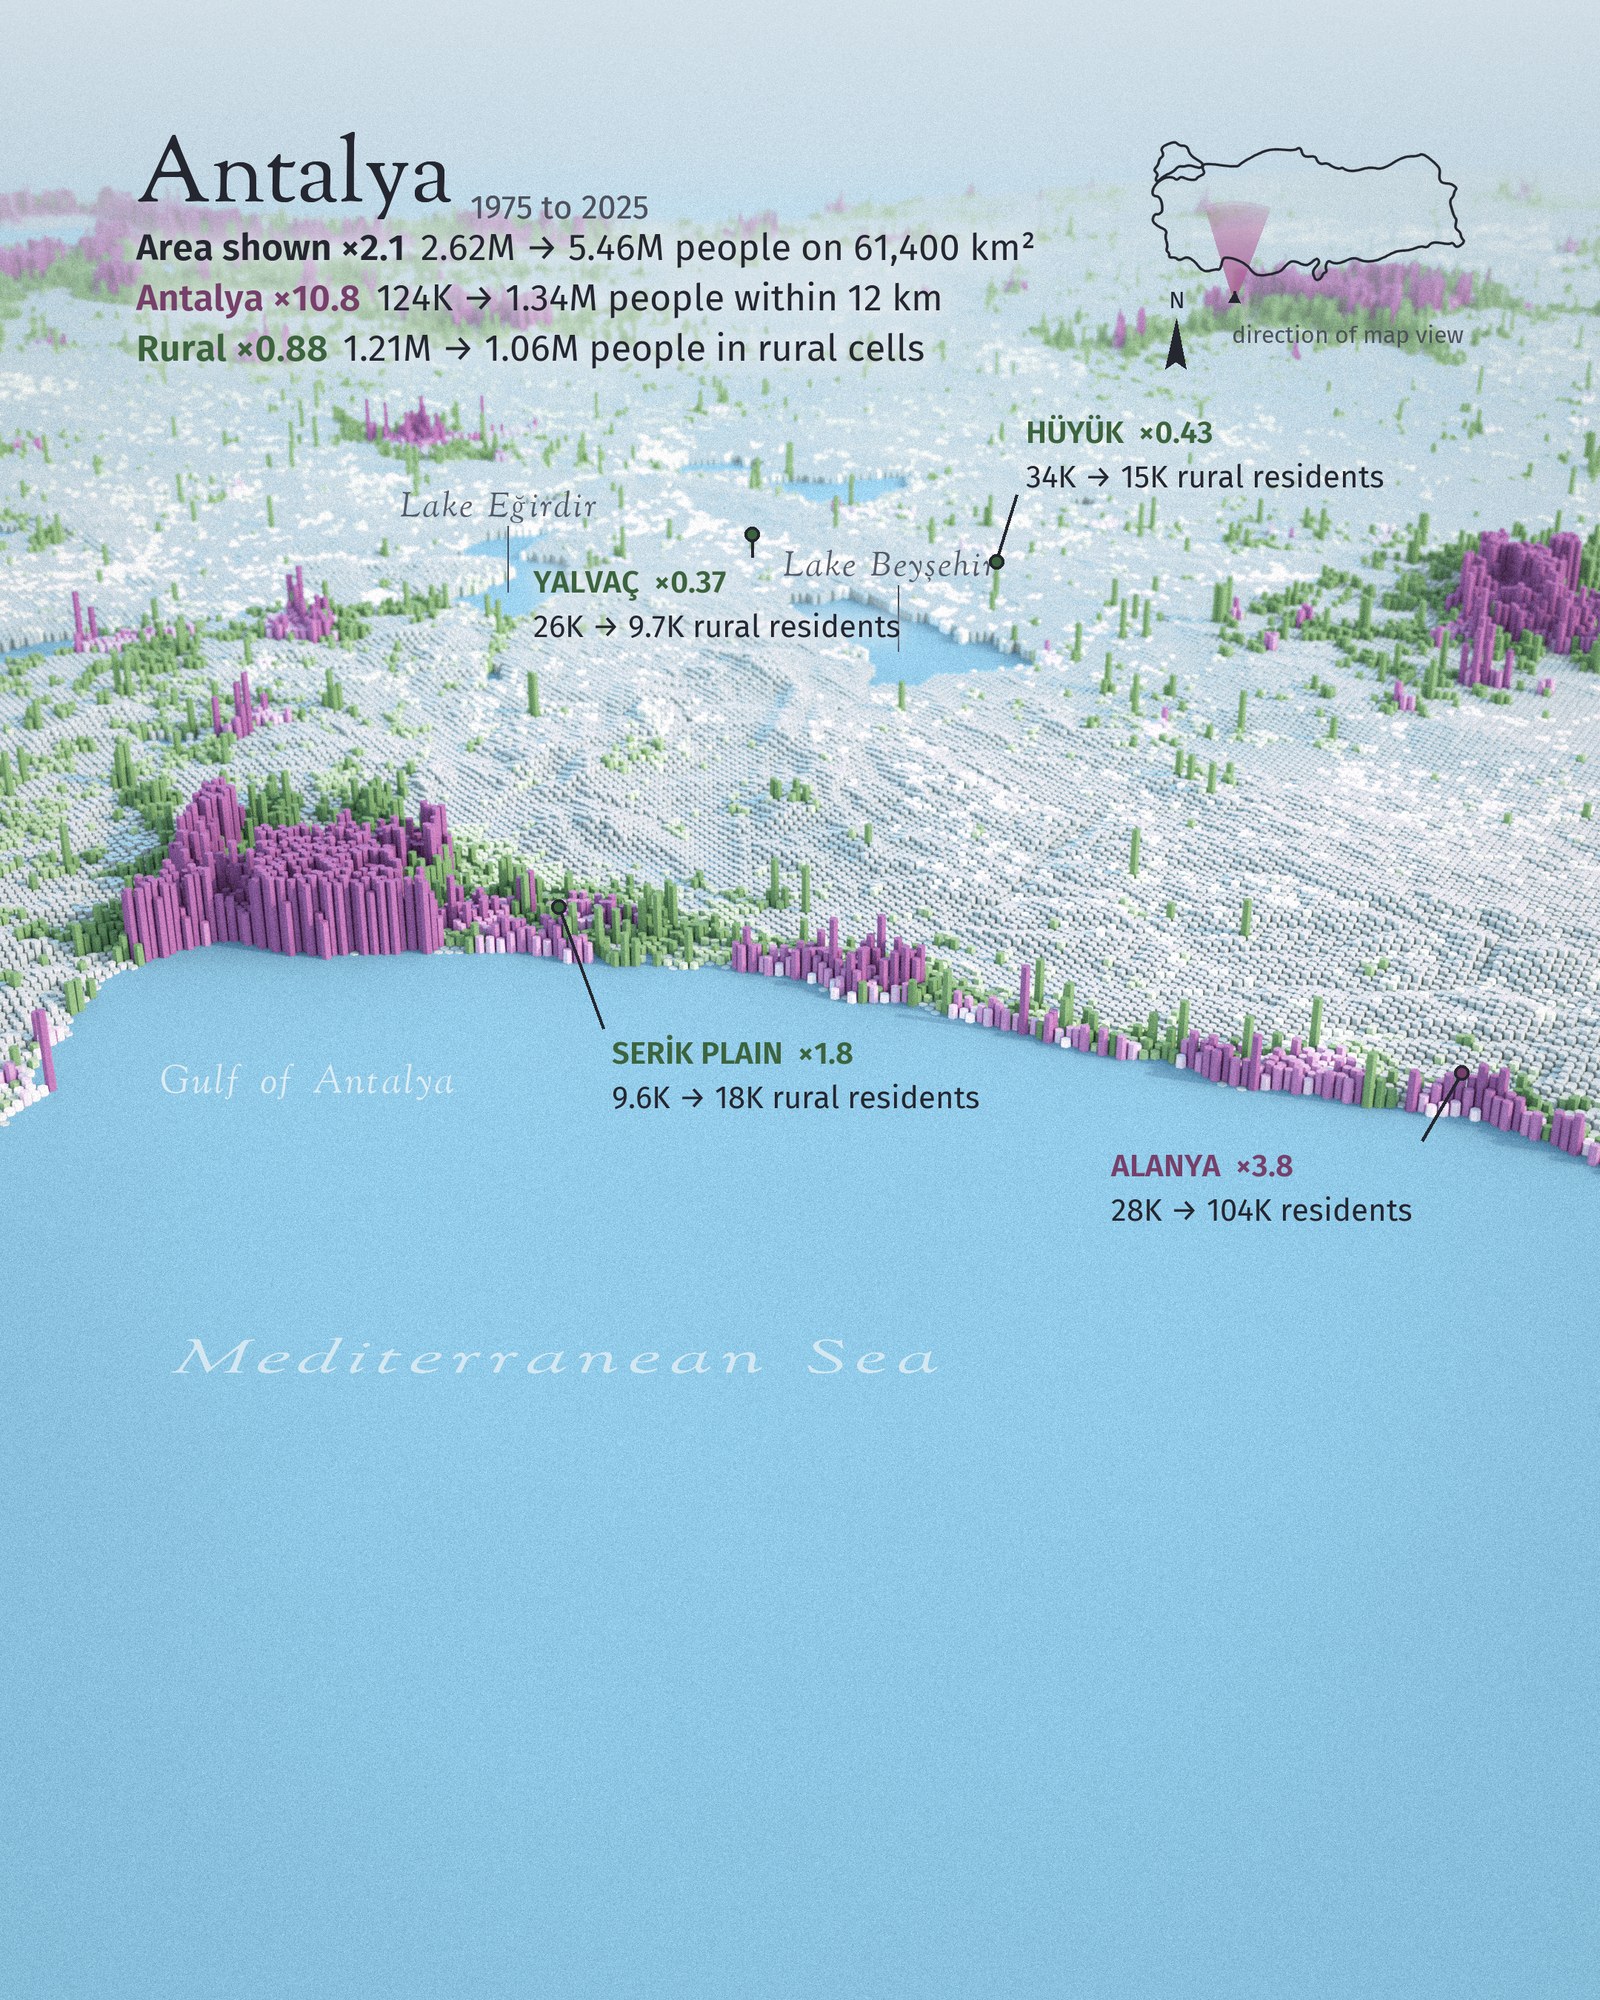
Antalya is the one I keep coming back to. Within 12 km of the center, the population grew 10.8 times. Go inland, around Yalvaç and Hüyük, and more than half of the rural people are gone.
Data and method
Population is GHS-POP R2023A from the European Commission's Joint Research Centre, 1975 and 2025 at 100 m. One thing to know: 1975 is a model reconstruction and 2025 a projection, not census counts. Urban and rural come from GHS-SMOD, the Degree of Urbanization grid, set separately for each year. I summed it all into equal-area hexagons, 50 km² for the country and 1 km² in 3D. City figures are people within a circle around each place. These aren't comparable with TÜİK's urban and rural numbers; they're built differently.
One more thing, found after posting when someone asked for a Çukurova close-up. GHS-POP gets some places in Türkiye wrong. Its 1975 and 2025 layers come from 2010 district figures pushed back and forward with each district's 2000 to 2010 growth. Where districts were split in 2008 (Adana, central İzmir, parts of İstanbul) or the 2000 census was inflated (parts of the Black Sea), that trend comes out wrong. Adana in 2025 is only about two thirds of the TÜİK figure. So I took the İzmir view out. On the map, Adana, the İzmir core and Esenyurt and Beylikdüzü grew more than they show, and the Black Sea losses look bigger than they were.
References
- Schiavina, M., Freire, S., Carioli, A., & MacManus, K. (2023). GHS-POP R2023A: GHS population grid multitemporal (1975-2030). European Commission, Joint Research Centre, doi:10.2905/2FF68A52-5B5B-4A22-8F40-C41DA8332CFE (CC BY 4.0).
- Schiavina, M., Melchiorri, M., & Pesaresi, M. (2023). GHS-SMOD R2023A: GHS settlement layers, application of the Degree of Urbanisation methodology (stage I) to GHS-POP R2023A and GHS-BUILT-S R2023A, multitemporal (1975-2030). European Commission, Joint Research Centre, doi:10.2905/A0DF7A6F-49DE-46EA-9BDE-563437A6E2BA (CC BY 4.0).
- Dijkstra, L., Florczyk, A. J., Freire, S., Kemper, T., Melchiorri, M., Pesaresi, M., & Schiavina, M. (2021). Applying the Degree of Urbanisation to the globe: a new harmonised definition reveals a different picture of global urbanisation. Journal of Urban Economics, 125, 103312, doi:10.1016/j.jue.2020.103312.
- Wessel, P., & Smith, W. H. F. (1996). A global, self-consistent, hierarchical, high-resolution shoreline database. Journal of Geophysical Research, 101(B4), 8741-8743, doi:10.1029/96JB00104 (GSHHG 2.3.7).
- Ryan, W. B. F. et al. (2009). Global Multi-Resolution Topography synthesis. Geochemistry, Geophysics, Geosystems, 10, Q03014, doi:10.1029/2008GC002332 (GMRT, 3D views only, CC BY 4.0).
- Natural Earth, 1:10m admin-0 countries, public domain. Place names checked with OpenStreetMap (© OpenStreetMap contributors, ODbL).