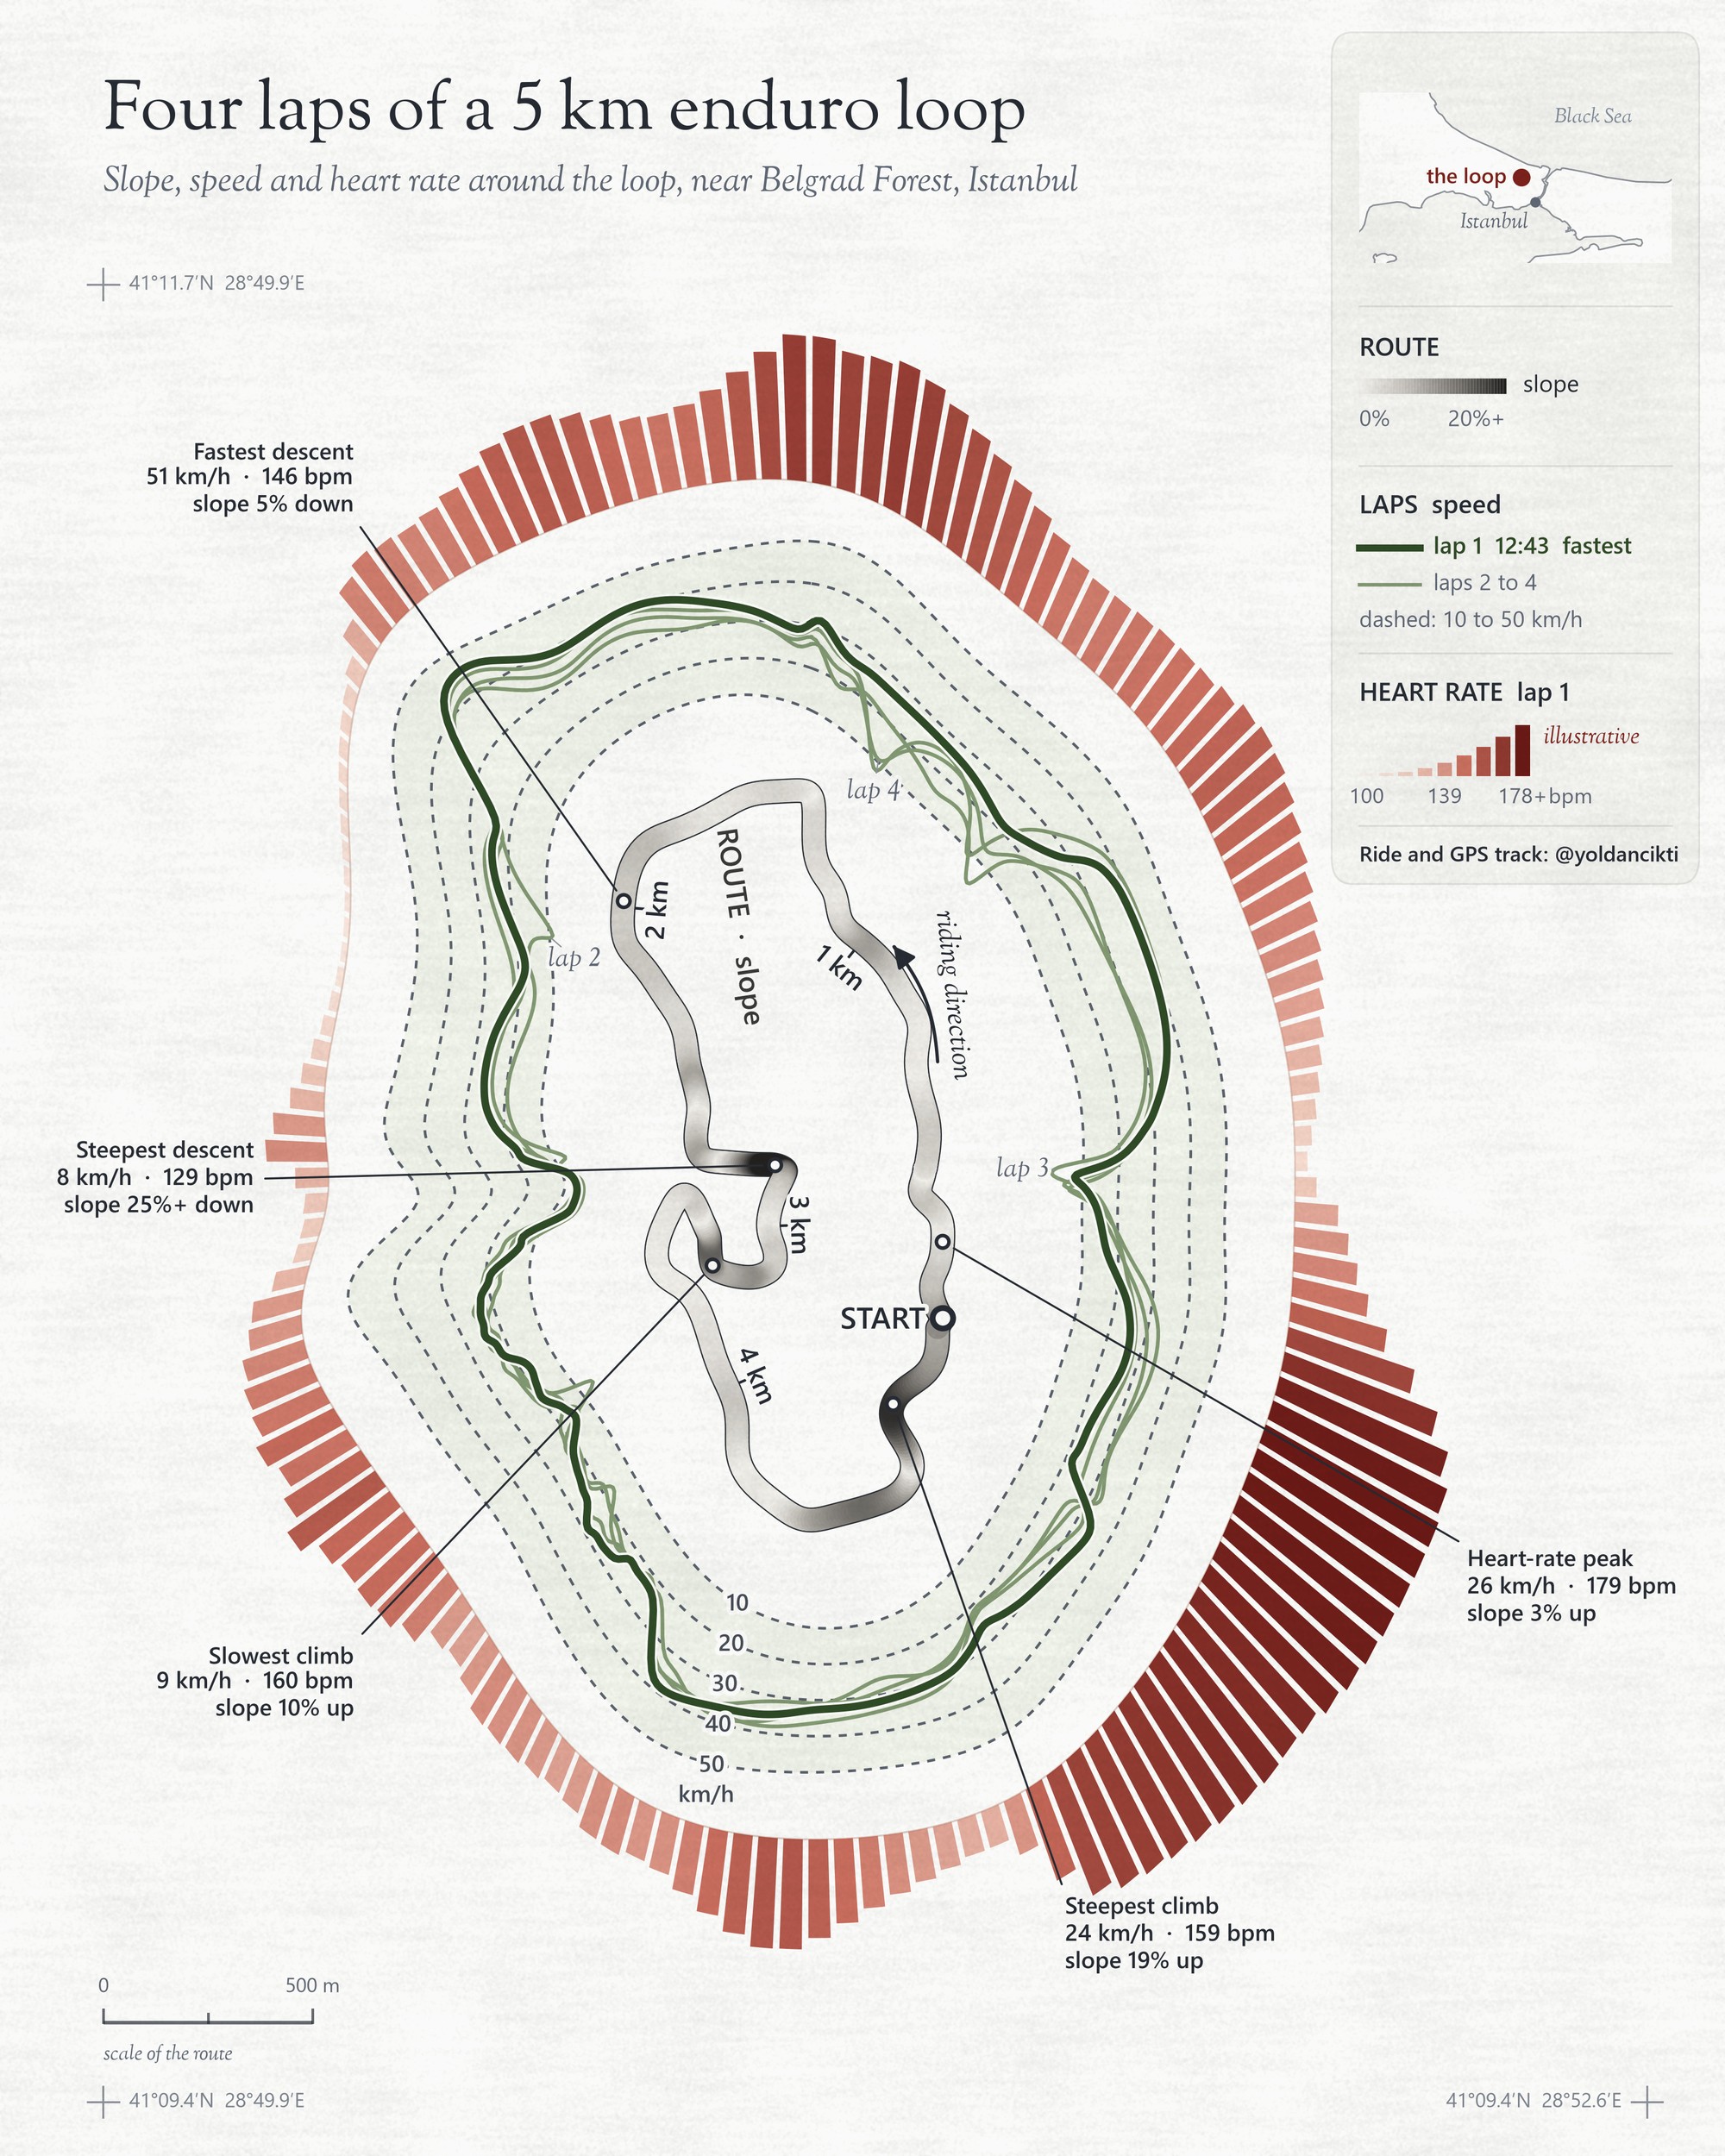
Day 10's theme is "Prompting only", so this map was made only by prompting, with Claude Code. No image generator was involved: the AI wrote code, and the code drew the map from the real ride data. What you see here is that direct output, untouched. I didn't open a design program.
The map shows three things at once around a 5 km enduro loop near Belgrad Forest, Istanbul, ridden four times by @yoldancikti.
- Slope on the route itself, from light (flat) to dark (steep).
- Speed on each lap in the middle ring. The bold line is lap 1, the fastest (12:43).
- Heart rate as the piano keys around the outside: the longer and darker the key, the higher the heart rate.
Sketching the idea and bringing in the GPS track is the easy part, and any mapping or design program you know can do it. What you can't easily do by hand is make every key, every line and every curve match the data exactly, all around a curved shape, without losing the proportions. That needs code. With an AI coding agent (Claude Code), I described what I wanted in plain words and got code that does the geometry correctly. That wasn't easy. As someone a bit obsessive about getting things right, I went back and forth on the design a thousand times, and every change, down to moving one label, had to be asked for in words.
Not everything needs AI. For this kind of work it helped me most: an artistic idea that has to stay true to the data.
Three steps: what went in, what came out
1. Clean the ride data. In: one GPX file from @yoldancikti's ride, a position every second, four laps of the loop. Done: GPS jitter smoothed out, the four laps found, speed computed, slope computed from the terrain elevation along the track, and an illustrative heart rate modeled from speed and slope. Out: one clean table with time, position, lap, speed, slope and heart rate for every second.
2. Turn the data into geometry. In: that table. Done: one center for the whole loop, 720 directions around it, and for each direction the route position, each lap's mean speed and lap 1's heart rate. Then the three rings, every value placed in proportion. Out: the shapes in exact coordinates: the route, four lap lines, 150 keys and the callout lines.
3. Design and check. In: those shapes. Done: colors, line weights, the legend, the locator and every label. Each label is checked against every point, line, key and other label before it is placed, so nothing touches. Out: the finished poster.
How it works
- One center for everything. All three rings are measured along straight lines from one point, the center of the loop's GPS points, in 720 directions (every half degree). Follow any piano key inward and it points at the same place on the speed ring and on the route.
- The route is the real GPS track of lap 1, at true scale and north up, only lightly smoothed to remove GPS jitter. Its color is the slope. The scale stops at 20%: most of the loop is under 14%.
- The speed ring. For each lap and each direction, the mean speed is drawn outward from the route in proportion; the dashed lines are 10 to 50 km/h. Where a lap slowed down, its line dips toward the route. The ring's shape blends the route's own outline with a smooth ellipse, and the spacing is corrected so the dashed lines are evenly spaced all the way round.
- The heart-rate keys. 150 keys of the same width with the same gap, pointing straight out from the same center. Each shows lap 1's mean heart rate in its directions, on a scale from 100 to 178 bpm (the ride's 2nd to 99th percentile); length grows with the square of the scale so the peaks stand out. The heart rate is illustrative: there was no heart-rate monitor, so it is modeled from the real speed and slope.
- The callout lines run from one GPS point straight out through all three rings, with the exact values at that point, not averages: the heart-rate peak (179 bpm), the fastest descent (51 km/h), the steepest descent (25%+ down), the slowest climb (9 km/h) and the steepest climb (19% up).
- One limit: where the route passes the same direction twice, the rings show the average of both passes.
All the smoothing is there for the eye, but it never changes the order or the proportions of the data: a faster stretch is always further out, a higher heart rate always a longer key.
The prompts
The short version, the one I would start with:
Draw a 4:5 poster of a GPS loop ridden 4 times. Use one center (the mean of all
lap points) and measure everything along rays from it, in 720 directions.
Inner ring: the real lap 1 route at true scale, north up, lightly smoothed,
colored by slope (0 to 20%, light to dark gray).
Middle ring: for each lap, mean speed per direction drawn outward from the route,
0 to 50 km/h, dashed guides every 10 km/h; fastest lap bold, others faint.
Outer ring: 150 equal piano keys with equal gaps, radial from the same center;
key length and shade = heart rate of the fastest lap.
Label the extremes with one line from the route through all three rings.
No text may touch another text, line or key.And the full set, step by step, the way the map was actually built:
STEP 1  DATA
Read the GPX (1 Hz). Smooth GPS jitter (Gaussian, about 2 s). Find the laps
(each pass through the start). Compute speed from the smoothed positions and
median-filter spikes. Take elevation along the track from a terrain model and
compute the slope (grade), smoothed over about 6 s, capped at 25%.
If there is no heart-rate file, model one from effort (speed x slope) with a
rise of about 25 s and a recovery of about 45 s, and label it illustrative.
Output one table per second: time, position, lap, speed, slope, heart rate.

STEP 2  GEOMETRY
Center = mean of all lap points. Split the circle into 720 directions.
For each direction: the route's outer radius, each lap's mean speed, lap 1's
mean heart rate.
Route: lap 1 at true scale, north up.
Speed ring: 0 km/h edge = 70% route outline + 30% fitted ellipse, lifted so it
never touches the route. Draw each lap's speed outward in proportion; correct
the radial step so the dashed guides are evenly spaced across the curve.
Heart-rate ring: a smoothed copy of the speed ring's outer edge plus a gap.
150 keys, equal width, equal gaps, all pointing out from the same center;
length = (heart-rate scale)^2, 100 to 178 bpm.
Callouts: find the extremes on lap 1 (fastest descent, steepest climb and
descent, slowest climb, heart-rate peak); draw one straight line from that GPS
point out through all three rings; print speed, heart rate and slope there.

STEP 3  DESIGN
Paper ivory, no pure white or black. Route in grays by slope, laps in greens
(fastest bold, others faint), keys in reds, shorter keys lighter.
Legend in a small box at the top right: route slope, lap speed, heart rate,
with a locator map. Check every label against every point, line, key and other
label before placing it; move it until nothing touches.Data
GPS track: ride by @yoldancikti (not redistributed). Heart rate: illustrative, modeled from speed and slope. Locator: Natural Earth. Made with Claude Code, Python and matplotlib.