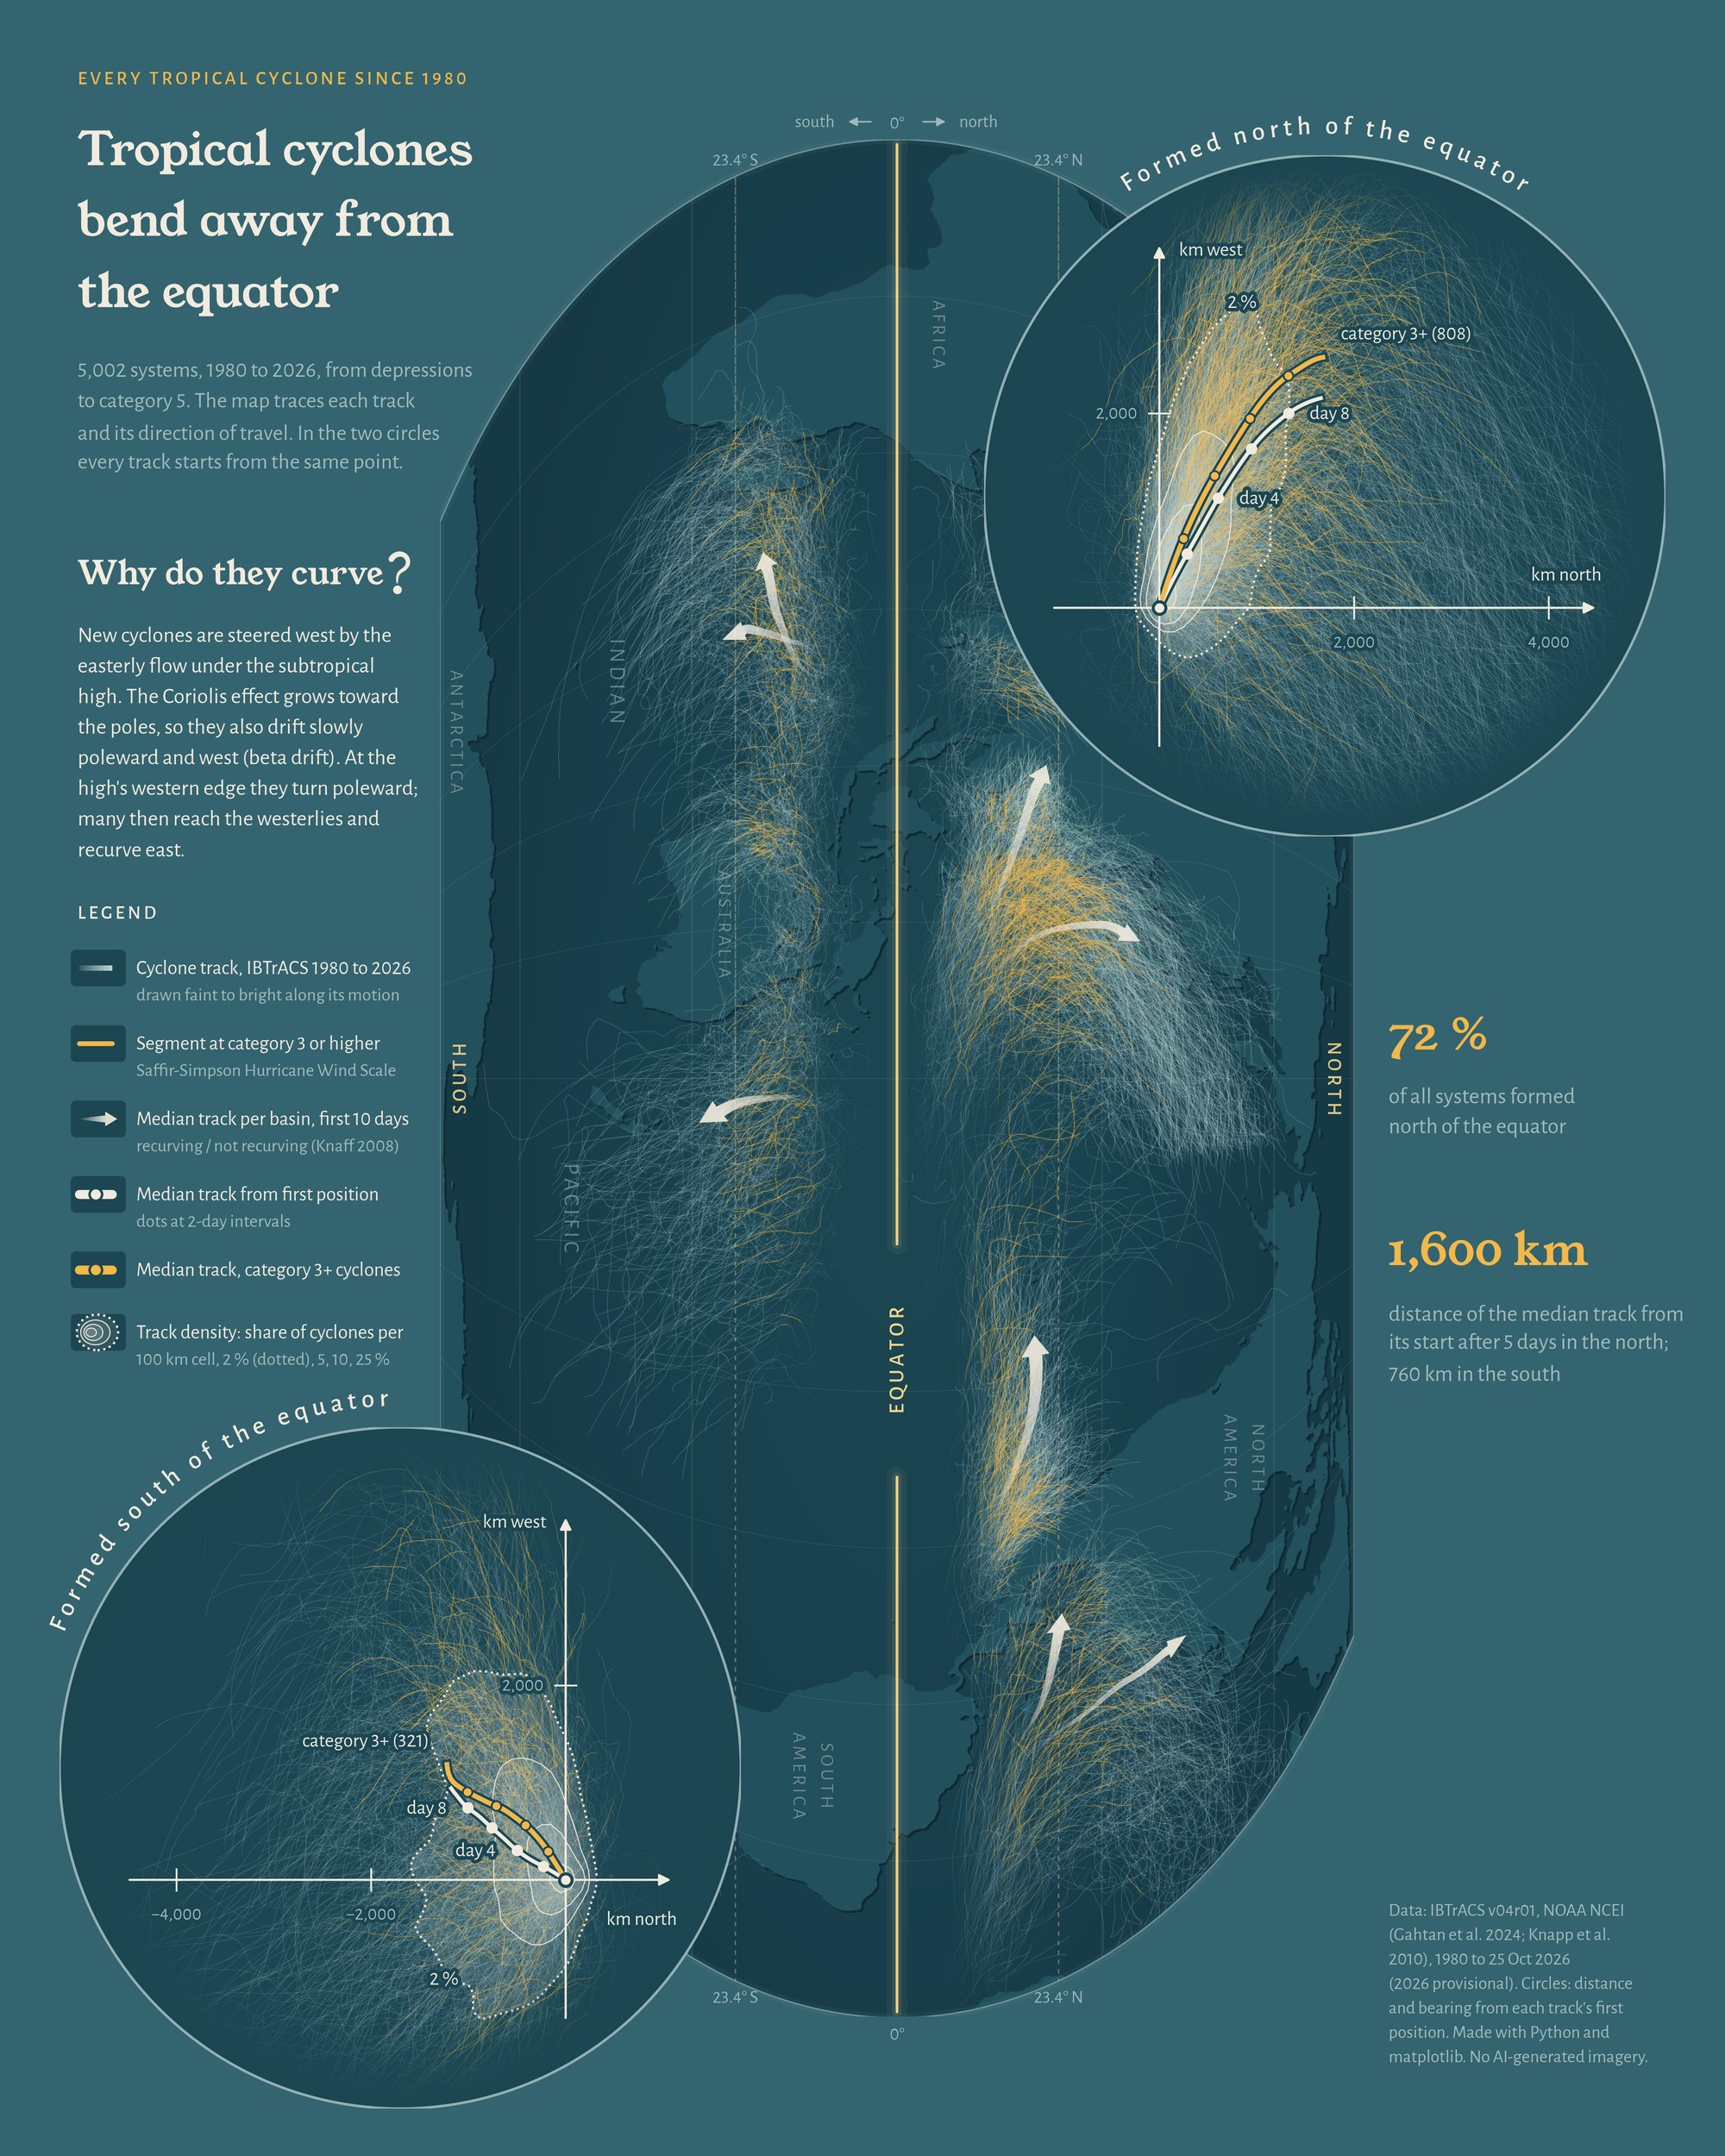
On a map, tropical cyclones look chaotic: thousands of tangled lines over every warm ocean. This map shows every system in the IBTrACS archive since 1980, 5,002 of them, from tropical depressions to category 5, and asks a simple question: what if they all started from the same place?
The world map is turned on its side, so north is to the right and the equator runs down the middle. Each track starts faint and gets brighter along its motion, so the direction of travel reads at a glance; amber marks the stretches where a cyclone was category 3 or stronger on the Saffir-Simpson Hurricane Wind Scale. A tapered arrow in each basin traces the median track over the first ten days. In the West Pacific, North Atlantic and southern Indian Ocean roughly half the cyclones recurve (48%, 46% and 55%), so those basins get two arrows, one for recurving cyclones and one for the rest, each starting at its own group’s median first position and as wide as its share.
One starting point
In the two circles I moved every track so its first position sits on one point, keeping its true distance and bearing. The tangle turns into a fan. Cyclones that formed north of the equator drift west and bend to the right; those that formed south of it drift west and bend to the left. The easterly flow under the subtropical high steers them west. Because the Coriolis effect grows toward the poles, they also drift slowly poleward and west (beta drift). At the high’s western edge they turn poleward, and many reach the westerlies and recurve east. After five days the median northern track lies 1,600 km from its start (776 km north, 1,398 km west); the southern one lies 760 km away (631 km south, 426 km west). Northern systems also outnumber southern ones almost three to one: 72% formed north of the equator.
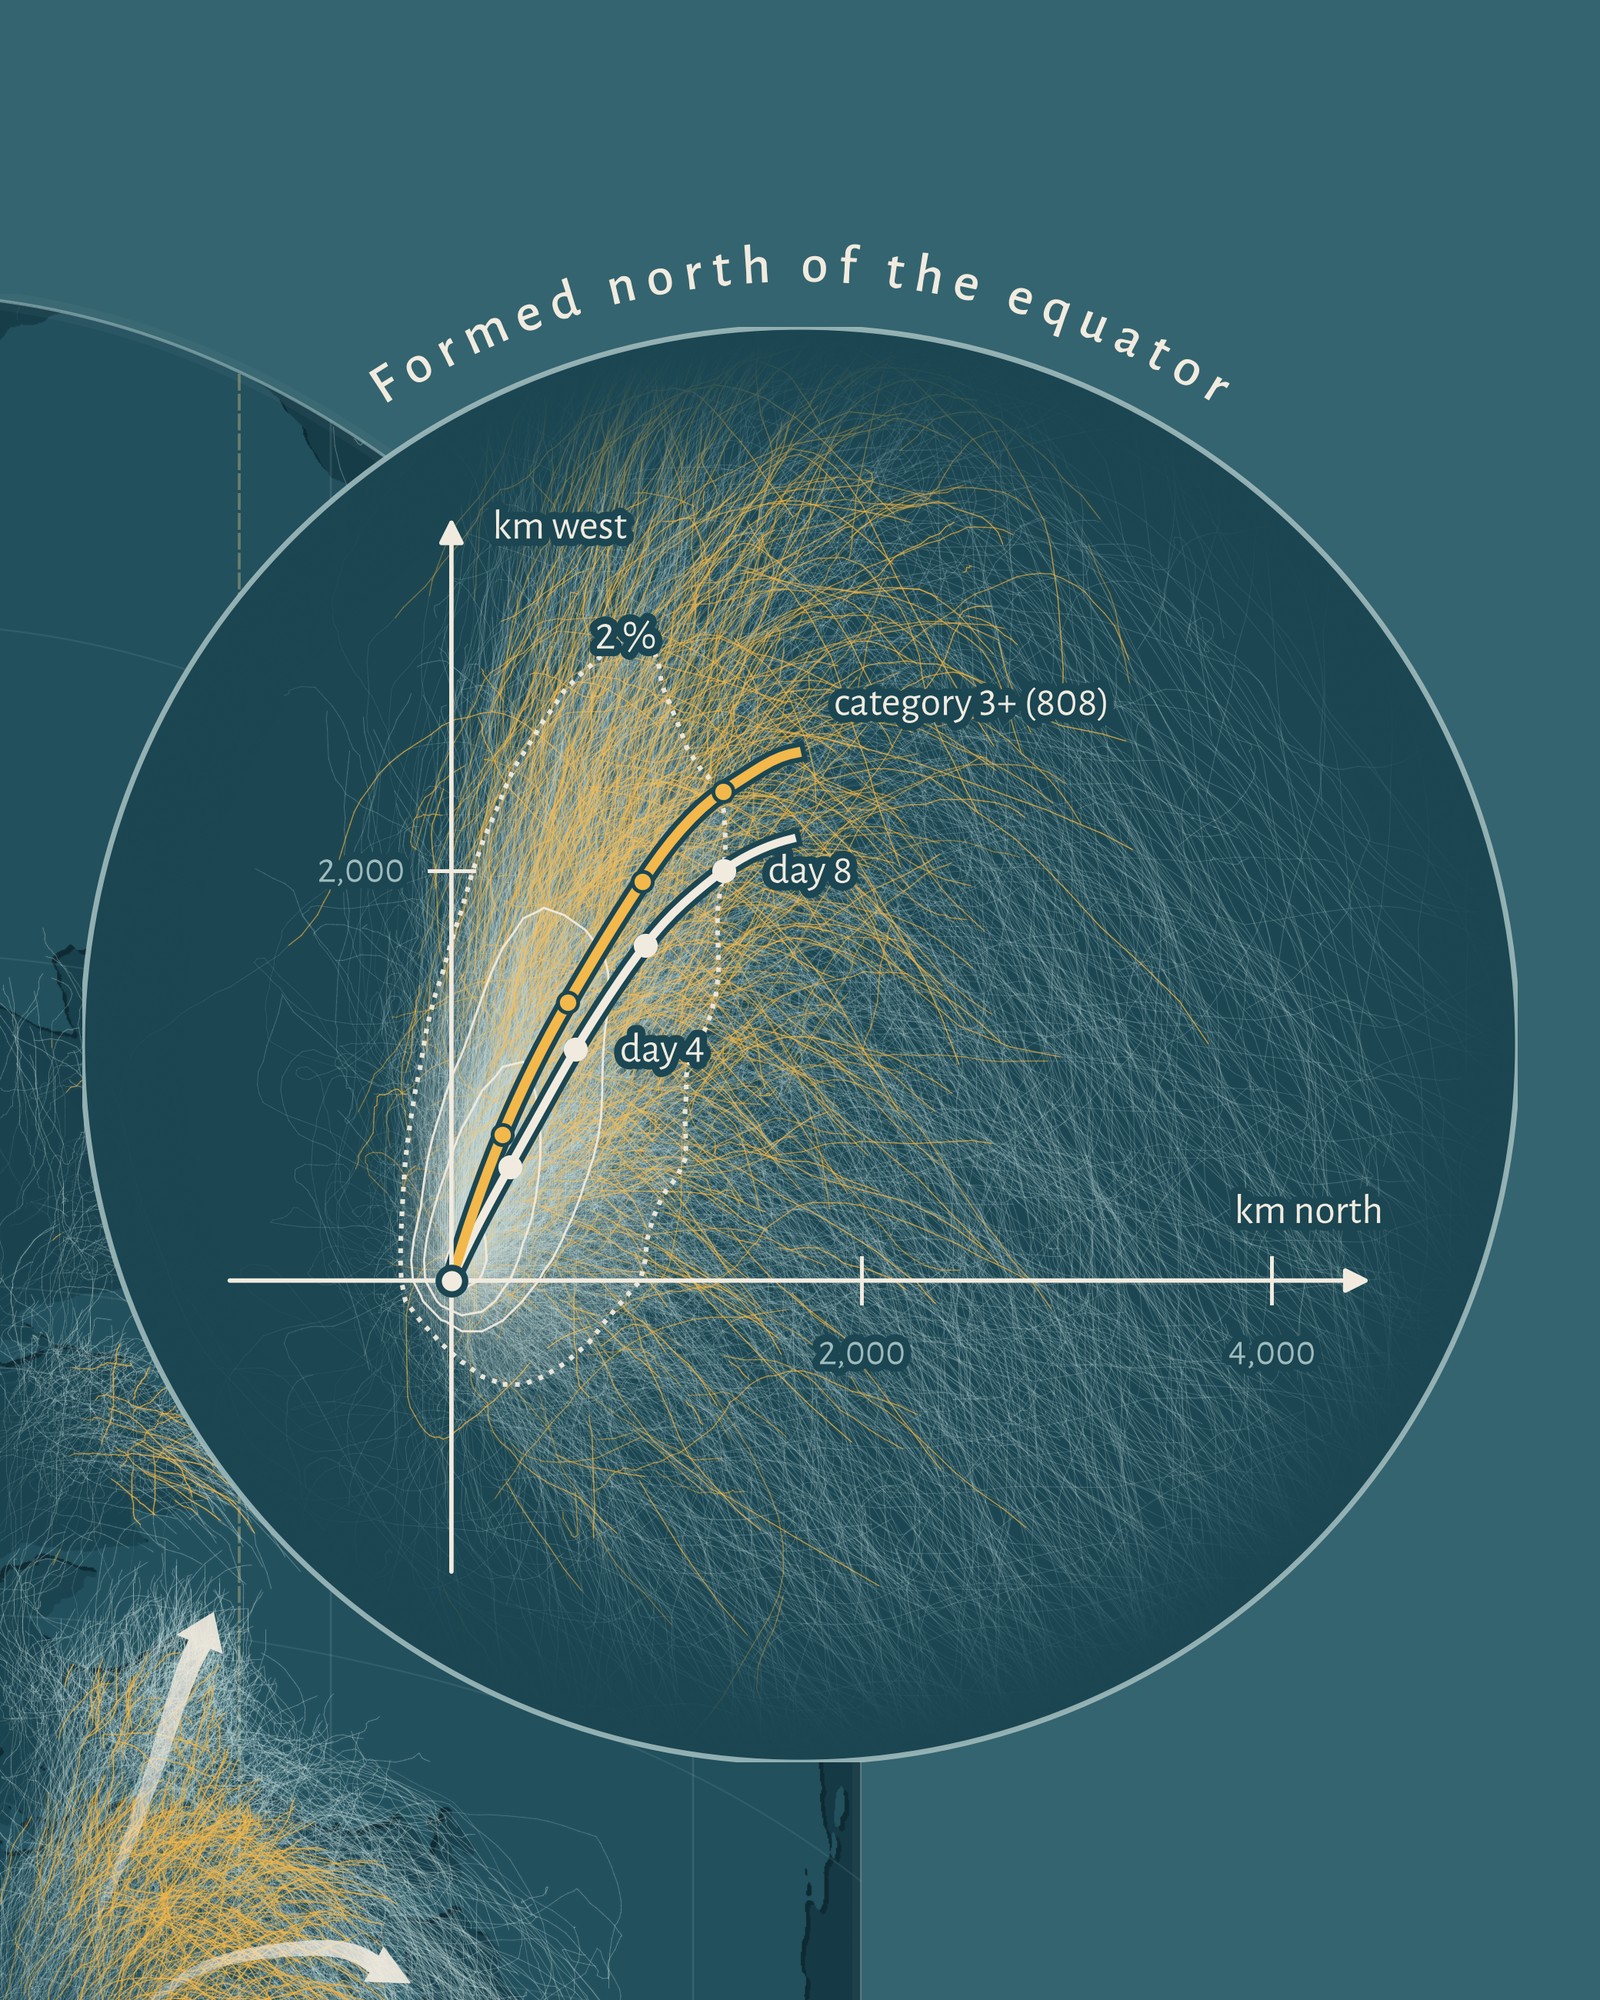
The contours in the circles show track density, the share of cyclones passing through each 100 km cell (2% dotted, then 5, 10 and 25%). A median track hides the variety: some cyclones recurve, others keep going west, and fewer remain alive at each later step. That is why the basins with many recurving cyclones get two arrows.
A 10-minute map
Day 7’s theme was a 10-minute map, so I made it with vibe coding. The map and the analysis took me under ten minutes with Claude Code. Most of the work went into the design: another 30-40 minutes of going back and forth with the AI. And yes, the design is vibe coded too.
Data and method
IBTrACS v04r01 since-1980 records to 25 October 2026 (2026 provisional); all systems with at least 4 positions. Map in Equal Earth (165° E). Circles: geodesic distance and bearing from each track’s first position, tracks resampled 6-hourly, component-wise median per step while at least 5% of tracks still exist; the drawn lines are lightly smoothed, the numbers come from the raw medians. Recurvature after Knaff (2008): the motion turns from westward to eastward while moving poleward (24-hour displacements). Category from US agencies (USA_SSHS). Made with Python (matplotlib, pyproj, geopandas, SciPy) and Claude Code; no AI-generated imagery.
References
- Gahtan, J., Knapp, K. R., Schreck, C. J., Diamond, H. J., Kossin, J. P., & Kruk, M. C. (2024). International Best Track Archive for Climate Stewardship (IBTrACS) Project, Version 4r01. NOAA National Centers for Environmental Information, doi:10.25921/82ty-9e16. Accessed 25 October 2026; 2026 records provisional.
- Knapp, K. R., Kruk, M. C., Levinson, D. H., Diamond, H. J., & Neumann, C. J. (2010). The International Best Track Archive for Climate Stewardship (IBTrACS): unifying tropical cyclone best track data. Bulletin of the American Meteorological Society, 91(3), 363-376, doi:10.1175/2009BAMS2755.1.
- Knaff, J. A. (2008). Revisiting the maximum intensity of recurving tropical cyclones. International Journal of Climatology, 29(6), 827-837 (issue dated 2009), doi:10.1002/joc.1746.
- Natural Earth, 1:10m admin-0 countries, public domain.