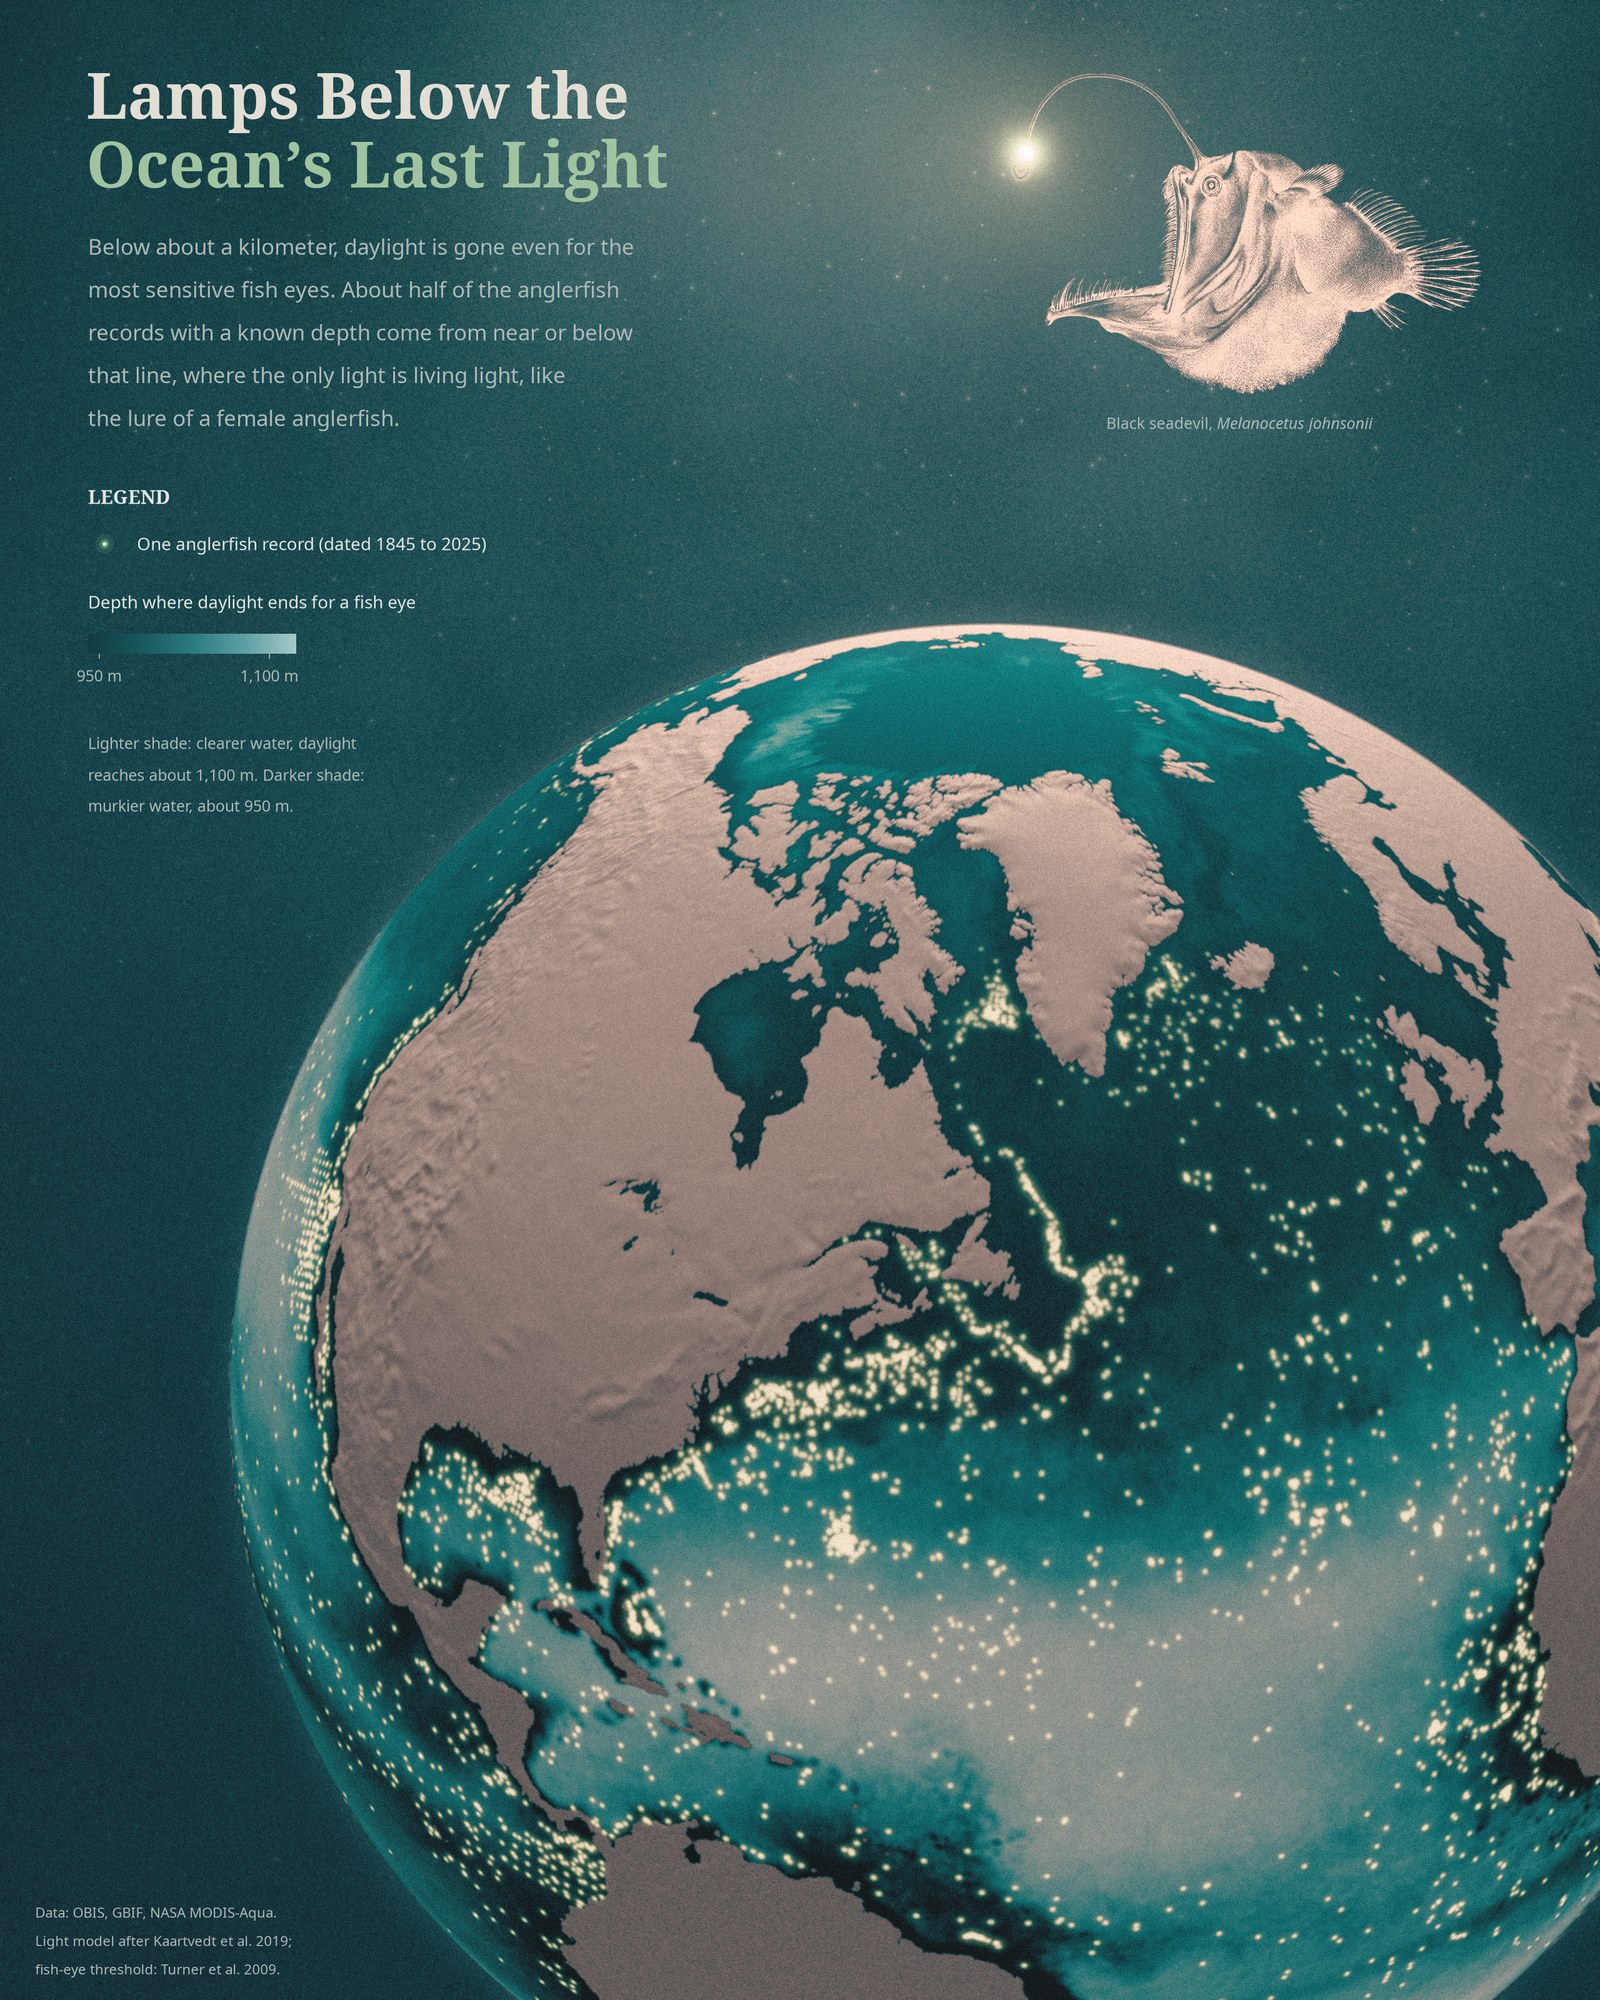
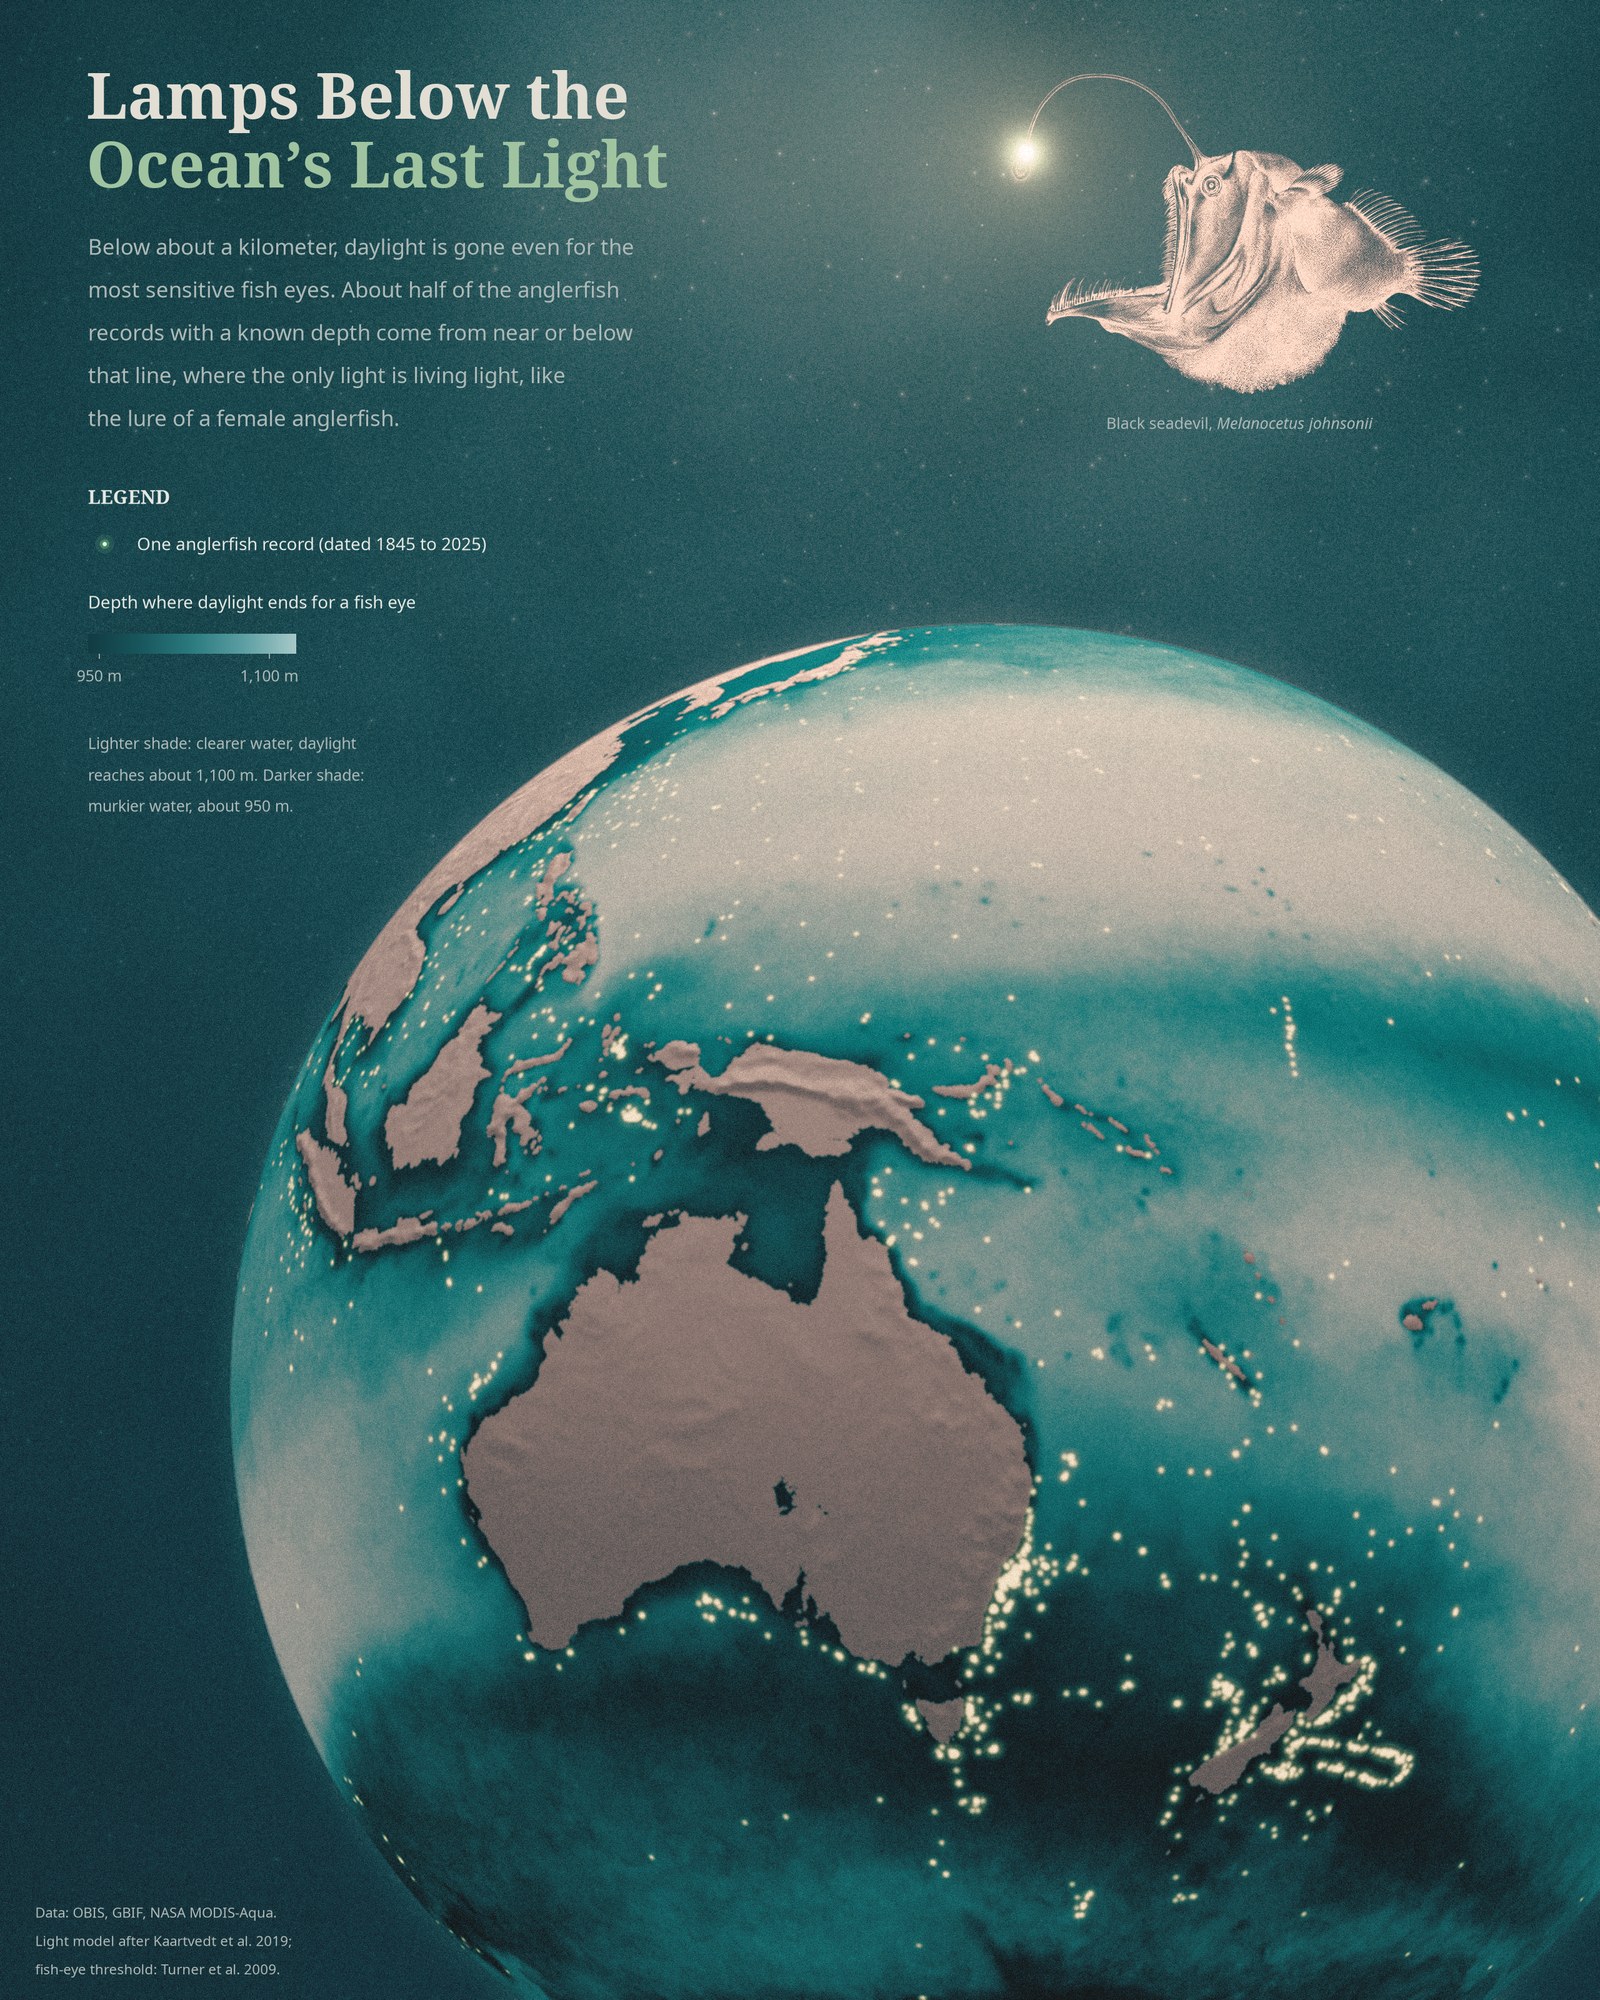
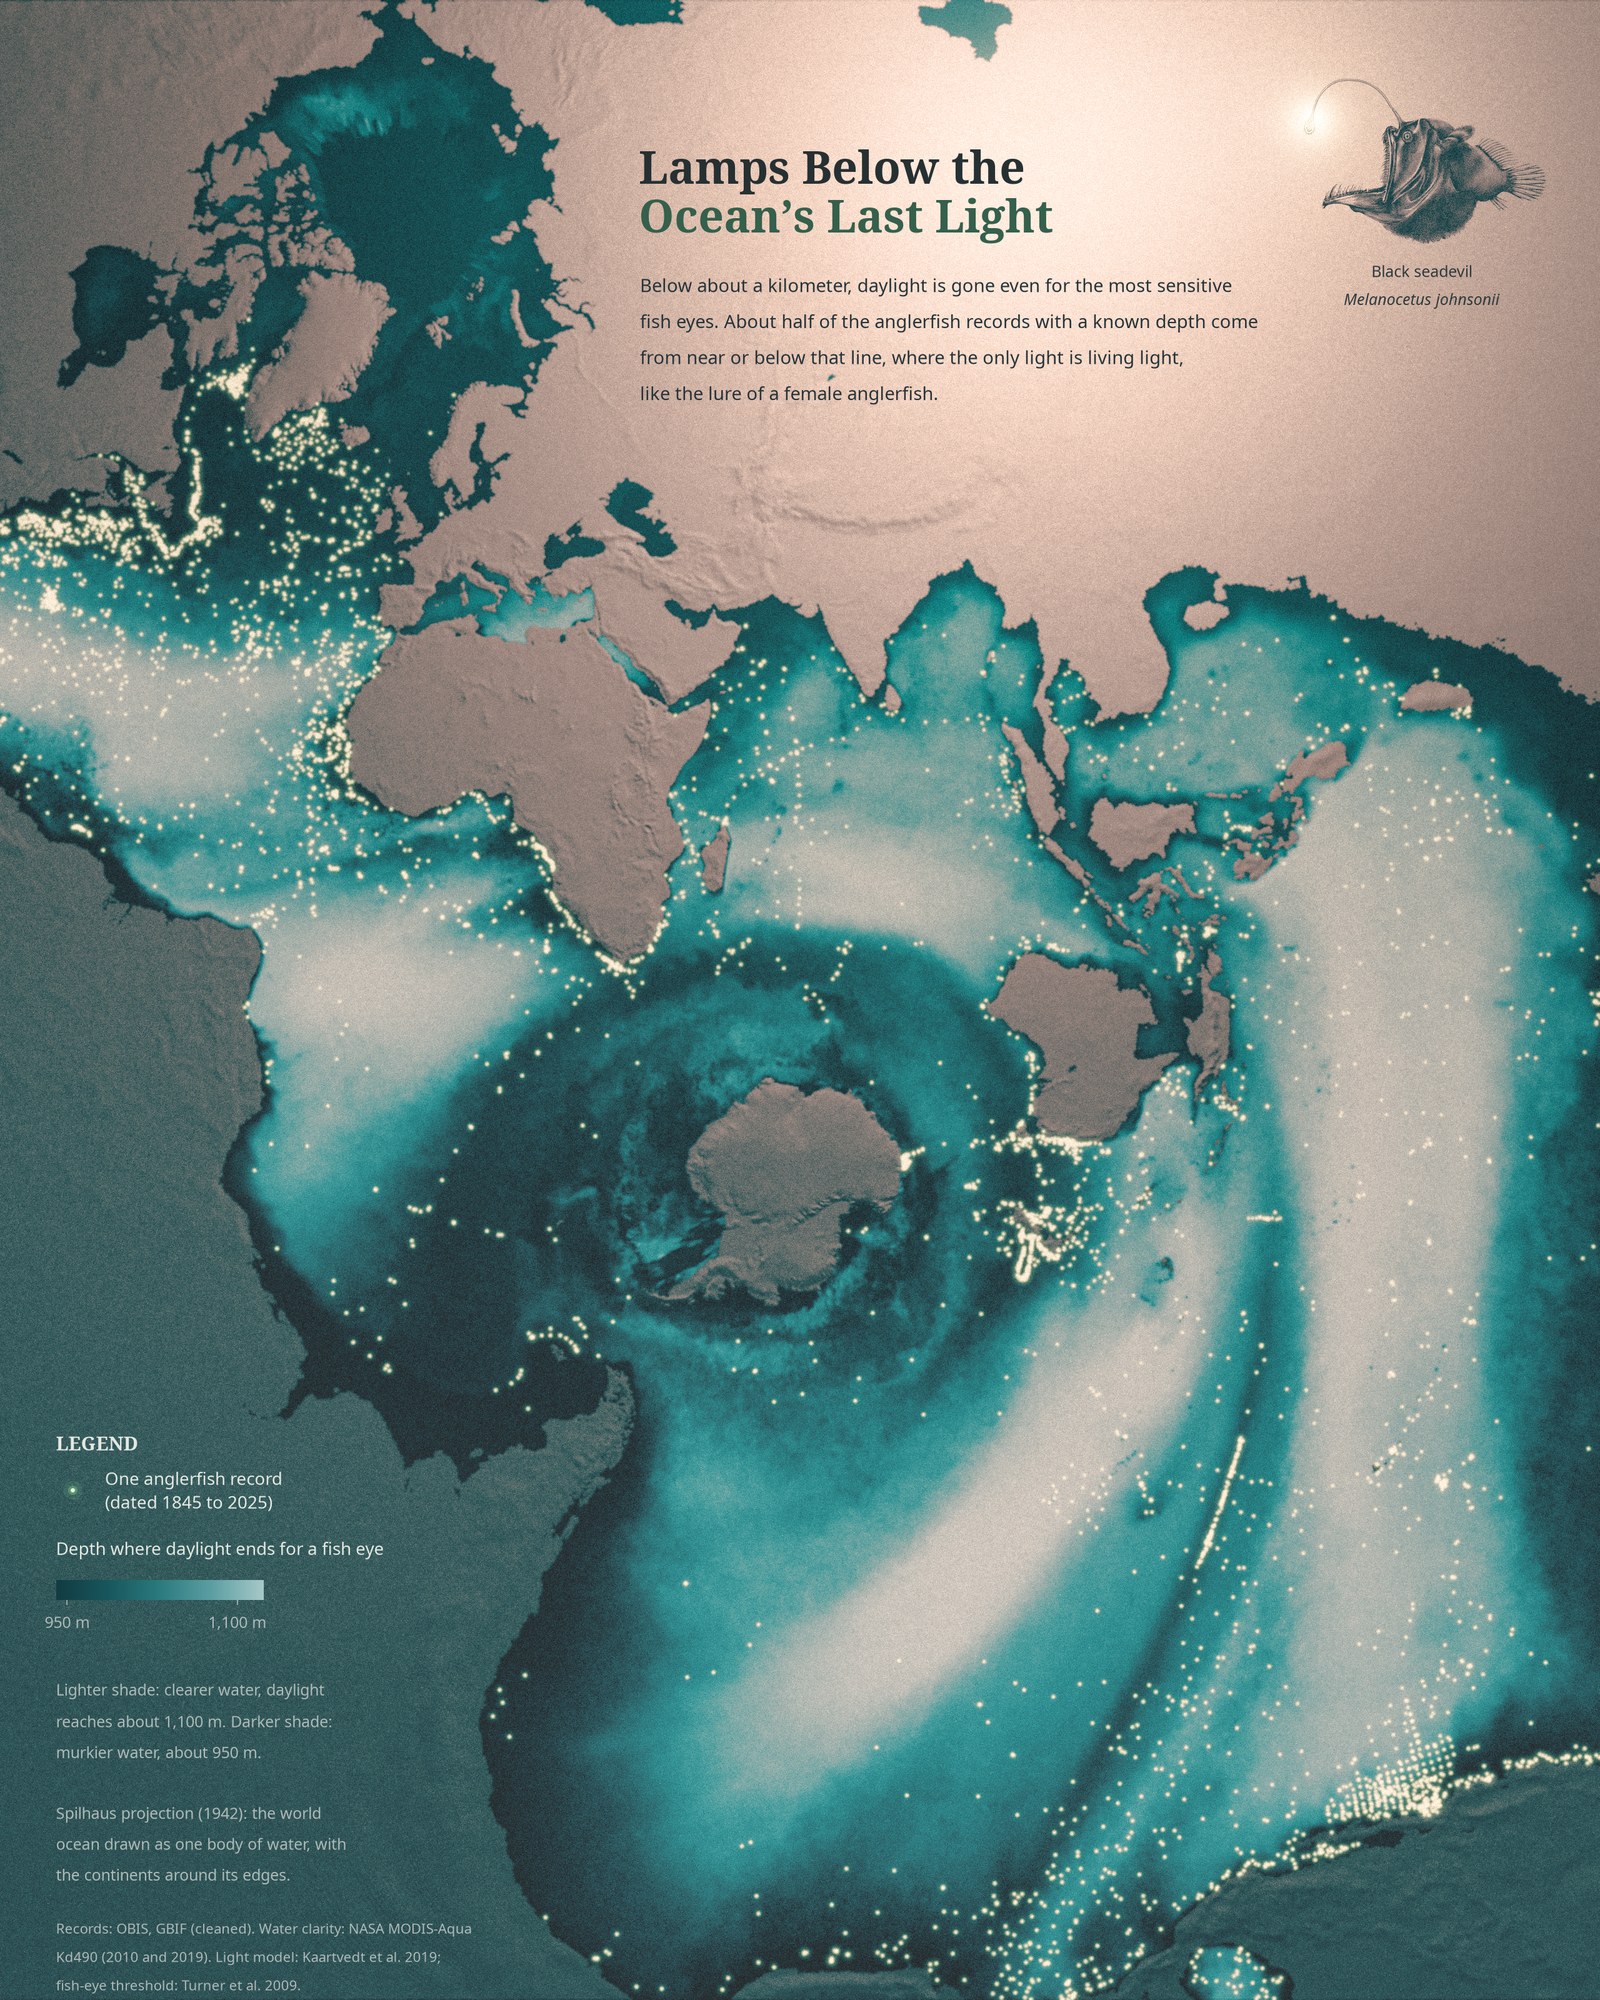
Day 17 is Light & dark. The ocean has its own edge between the two, and it is deeper than most people think. The familiar 200 m line is only the conventional bottom of the sunlit zone. Below it the light fades, but a sensitive deep-sea fish eye can still detect daylight down to about a kilometer in the clearest water.
The teal shade on the map is that limit: the depth where daylight becomes too dim even for such an eye. It depends on how clear the water is. In the clearest open ocean it lies around 1,100 m; in productive, murkier water around 950 m.
The glowing dots are 12,947 records of deep-sea anglerfishes (suborder Ceratioidei), from museum collections and survey databases. 4,804 of them have a usable depth, and about half of those (54 percent) lie below the line or less than 200 m above it. Down there the sun is gone, and the only light is the light animals make, like the lure a female anglerfish carries: in the species studied so far, a bulb lit by bacteria taken up from the seawater.
Method
Water clarity is the diffuse attenuation coefficient Kd490 from NASA’s MODIS-Aqua satellite, averaged over the monthly maps of 2010 and 2019. Light falls with depth following that value through the upper water column, then with a constant clear-ocean value below (K = 0.025 per meter), starting from a noon surface light of 1,000 µmol photons m⁻² s⁻¹. The limit is where light drops to about 10⁻⁹ µmol photons m⁻² s⁻¹, the threshold used by Kaartvedt and colleagues (2019) after Turner and colleagues (2009). With the less clear deep water measured in the Red Sea (K = 0.0366 per meter, Røstad and colleagues 2016), the line would sit 250 to 300 m shallower, so read the shade as a relative map of where daylight reaches deepest. The approach builds on satellite light maps (Davies and Smyth 2025) and on the finding that light sets the depth of the deep scattering layers of fish and other animals (Aksnes and colleagues 2017).
The records come from OBIS and GBIF, merged and cleaned: duplicates between the two removed, eDNA samples and points well inland dropped, and impossible depths (deeper than the seafloor) blanked. Many depths are the maximum depth of a net, so they are probably biased deep and the comparison is rough. The globes are lit in Blender by a single light at the lure; the record dots are drawn at their true positions.
References
- Kaartvedt, S., Langbehn, T. J. and Aksnes, D. L. (2019). Enlightening the ocean’s twilight zone. ICES Journal of Marine Science 76: 803-812.
- Turner, J. R. et al. (2009). Vision in lanternfish (Myctophidae): adaptations for viewing bioluminescence in the deep-sea. Deep-Sea Research I 56: 1003-1017.
- Røstad, A., Kaartvedt, S. and Aksnes, D. L. (2016). Light comfort zones of mesopelagic acoustic scattering layers in two contrasting optical environments. Deep-Sea Research I 113: 1-6; erratum 114: 162-164.
- Aksnes, D. L. et al. (2017). Light penetration structures the deep acoustic scattering layers in the global ocean. Science Advances 3: e1602468.
- Davies, T. W. and Smyth, T. (2025). Darkening of the global ocean. Global Change Biology 31: e70227.
- Pietsch, T. W. (2009). Oceanic Anglerfishes: Extraordinary Diversity in the Deep Sea. University of California Press.
- Baker, L. J. et al. (2019). Diverse deep-sea anglerfishes share a genetically reduced luminous symbiont that is acquired from the environment. eLife 8: e47606.
- NASA Ocean Biology Processing Group (2017). MODIS-Aqua Level 3 Mapped Downwelling Diffuse Attenuation Coefficient Data, Version R2018.0. NASA Ocean Biology DAAC.
- Records: OBIS and GBIF.org, accessed 17 November 2026.
- Relief: NOAA ETOPO1. Land: Natural Earth. Projection: Spilhaus (1942), via PROJ.
- Illustration: Melanocetus johnsonii, after G. H. Ford, in Günther, A. (1864), Proceedings of the Zoological Society of London, pl. XXV (public domain).